Campground Usage Analytics
Measure visitation, occupancy, and turnover across campgrounds and loops — the data to plan staffing, balance day-use and overnight access, and track seasonal demand.
Questions We Answer
How many visitors use the campground?
What are occupancy and turnover like?
How does day-use compare with overnight use?
How does demand change seasonally?
What We Measure
Visitor counts
Accurate counts at entries and loops.
Occupancy & turnover
Understand how sites fill and turn over.
Seasonal trends
Track demand across the camping season.
Access monitoring
Measure activity at campground access points.
Planning & Operations Applications
Beyond Reservations
Reservations tell you what was booked, not what actually happened. No-shows, early departures, day-use visitors, and guests who never registered all drive a gap between the reservation system and real on-the-ground activity. Entry and loop monitoring measures the campground as it's actually used — circulation, peak arrival windows, and true occupancy — giving managers a picture that a booking report alone can't provide.
Understand:
- Actual campground activity vs. reservations
- Loop and site utilization
- Visitor circulation
- Peak arrival windows
Occupancy, Turnover & Operations
Entry and loop counts reveal real occupancy and turnover — the basis for staffing, restroom servicing, and cleaning schedules, and for balancing day-use access against overnight demand. Aligning crews and services to when the campground is genuinely busy is where measured activity pays for itself.
Informs:
- Staffing and cleaning schedules
- Restroom servicing
- Day-use vs. overnight balance
- Access and gate management
Investment & Loop Planning
Camping demand is sharply seasonal and rarely even across loops. Knowing which loops fill first and which sit underused supports the longer-horizon decisions — where to add infrastructure, which areas to upgrade, and how to phase expansion.
Identify:
- High-demand loops
- Under-utilized areas
- Expansion opportunities
- Infrastructure priorities
Metrics We Capture
Every metric below is derived from image-validated detections — exportable and auditable, not modeled estimates.
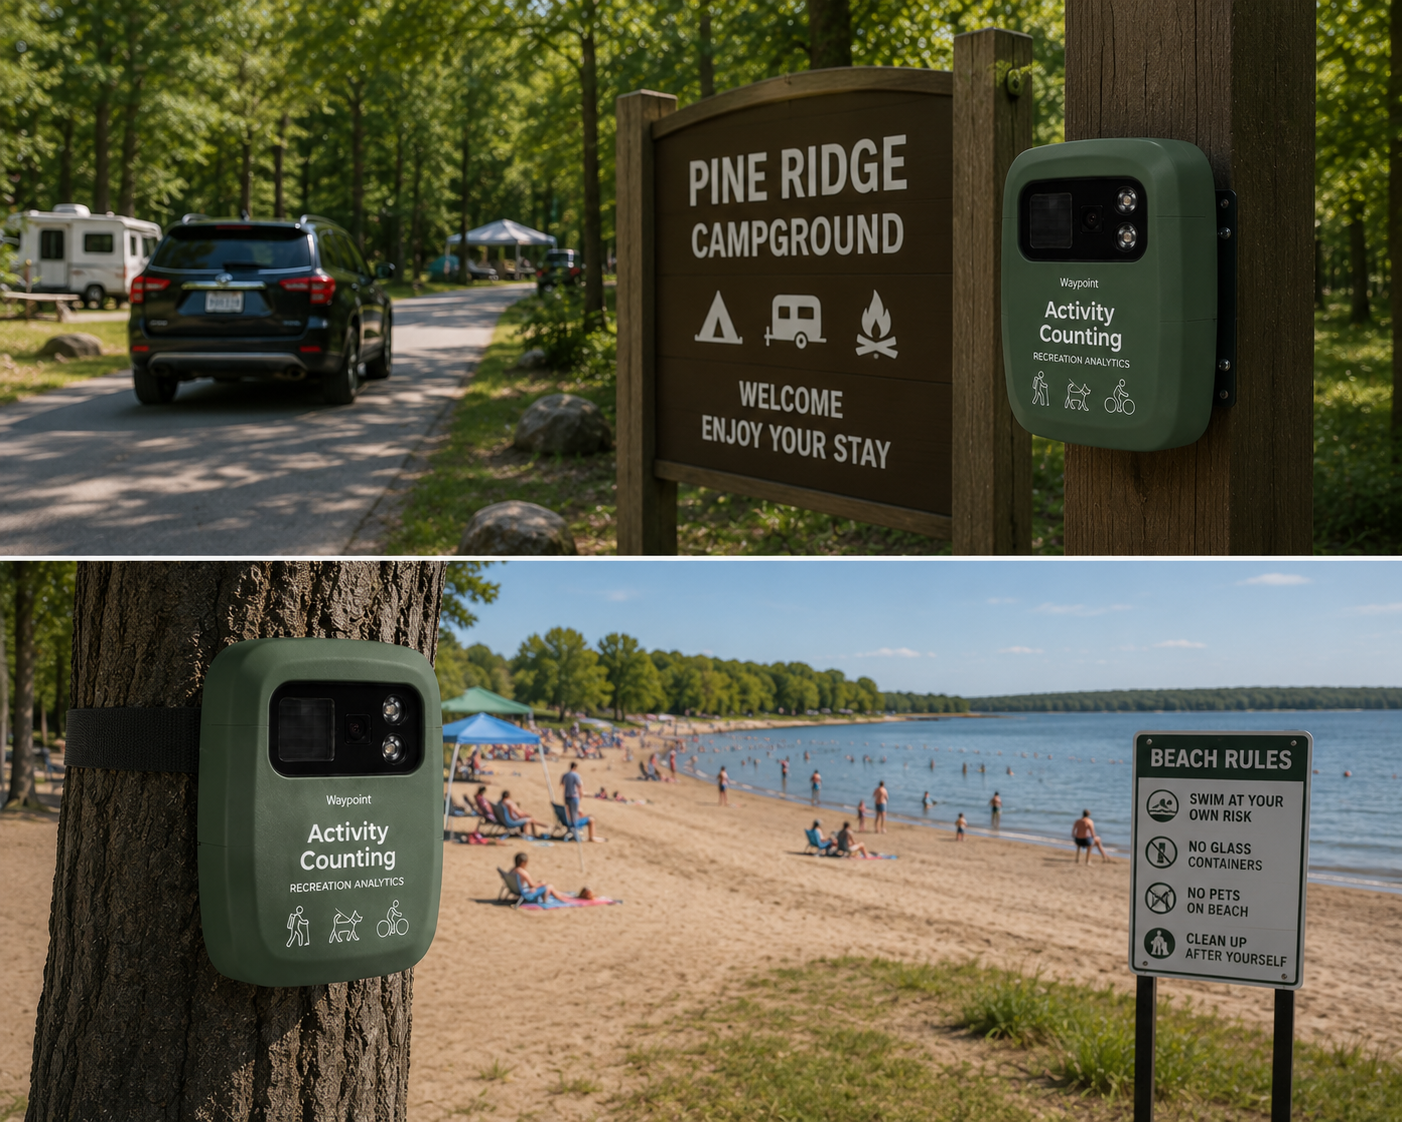
From Raw Image to Real-Time Insight
Solar-powered field stations capture imagery that our AI turns into clean, classified detections in seconds.