Park Usage Analytics
Understand how an entire park is used — which amenities draw the most activity, when peak periods occur, and how usage shifts across seasons — to guide operations, staffing, and investment.
Questions We Answer
Which amenities are most used?
When are the peak periods?
How does usage change seasonally?
How are people actually moving through the park?
Where should limited maintenance dollars go?
How should staffing align with demand?
What You Get
Amenity-level demand
See which features and zones draw the most activity across the park.
Seasonal patterns
Quantify how visitation shifts week to week and season to season.
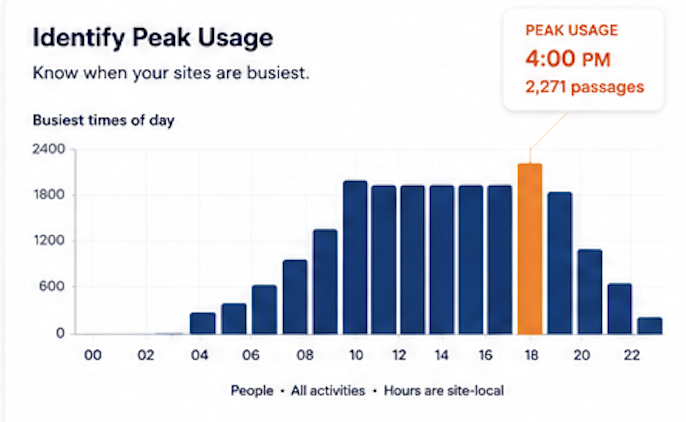
Peak-period insight
Plan staffing and maintenance around real high-traffic windows.
Whole-park visibility
Multistation deployments measure activity across the full site.
Planning & Operations Applications
Whole-Park Utilization
Many agencies know an annual visitation total but can't say how visitors actually move through a park. Multistation deployments measure activity across every amenity at once.
Waypoint can monitor activity across:
- Trails and connectors
- Playgrounds
- Courts and sport facilities
- Trailheads
- Beaches and waterfronts
- Boat launches
- Picnic areas and shelters
- Parking lots
Prioritize Investments With Real Usage Data
When maintenance and capital budgets are limited, usage data lets you prioritize by actual demand rather than the loudest anecdote.
Usage data strengthens decisions about:
- Capital improvement planning (CIP)
- Grant funding and applications
- Asset replacement timing
- Staffing allocation
- Maintenance scheduling
Especially useful when you need to:
- Defend a budget request
- Rank competing projects
- Show return on a past investment
Operations & Staffing
Peak-period and seasonal data lets operations align staffing, maintenance, and programming with when the park is actually busy.
- Schedule staff to real demand windows
- Time maintenance around low-use periods
- Plan programming for under-used amenities
Metrics We Capture
Every metric below is derived from image-validated detections — exportable and auditable, not modeled estimates.
What the Data Looks Like
Identify the peak periods when your park is busiest.
Explore Parks
Campgrounds
Measure visitation, occupancy, and turnover across campgrounds and loops — the data to plan staffing, balance day-use and overnight access, and track seasonal demand.
Dog Parks
Understand how heavily dog parks are used and how sites compare — the data to prioritize maintenance, plan amenities, and justify new locations.