Research & Planning Datasets
Consultants, planners, and grant writers need credible activity data on a schedule and a budget. Waypoint generates continuous, image-validated observational datasets — no manual counts, no field crews.
Questions We Answer
How do we get defensible usage data for this study?
Can we support a grant application with real numbers?
How do we validate a capital project's impact?
How do we measure usage without staffing field crews?
What variables can we actually measure?
How does this compare to surveys and counters?
What You Get
Study-ready datasets
Continuous, exportable observational data for reports and applications.
Defensible & auditable
Image-validated counts reviewers and boards can trust.
Deploy on your timeline
Temporary or permanent deployments stood up in hours.
Before/after measurement
Quantify the impact of investments and capital projects.
Research Applications
Build Rich Datasets Without Field Staff
Consultants, planners, and grant writers need credible activity data on a schedule and a budget. Waypoint generates continuous, image-validated observational datasets — no manual counts, no field crews.
These datasets support:
- Master plans
- Feasibility studies
- Grant applications
- Academic research
- Transportation studies
- Recreation planning
Variables That Can Be Measured
Depending on the deployment and site, a single Waypoint station can capture a wide set of observational variables from the same imagery.
Commonly measured variables:
- Counts
- Activity type
- Directionality
- Time of day
- Day of week
- Seasonal trends
- Facility occupancy
- User-behavior indicators
Metrics We Capture
Every metric below is derived from image-validated detections — exportable and auditable, not modeled estimates.
Traditional Methods vs. Waypoint
How observational methods compare for recreation and active-transportation research.
| Method | Trade-off |
|---|---|
| Manual observation | Accurate, but expensive and limited to short windows. |
| Intercept surveys | Rich detail, but small sample sizes and self-selection bias. |
| Infrared counters | Continuous, but no activity, direction, or validation. |
| Parking counts | Easy proxy, but only an indirect estimate of visitation. |
| Waypoint | Continuous, classified, directional, and image-validated. |
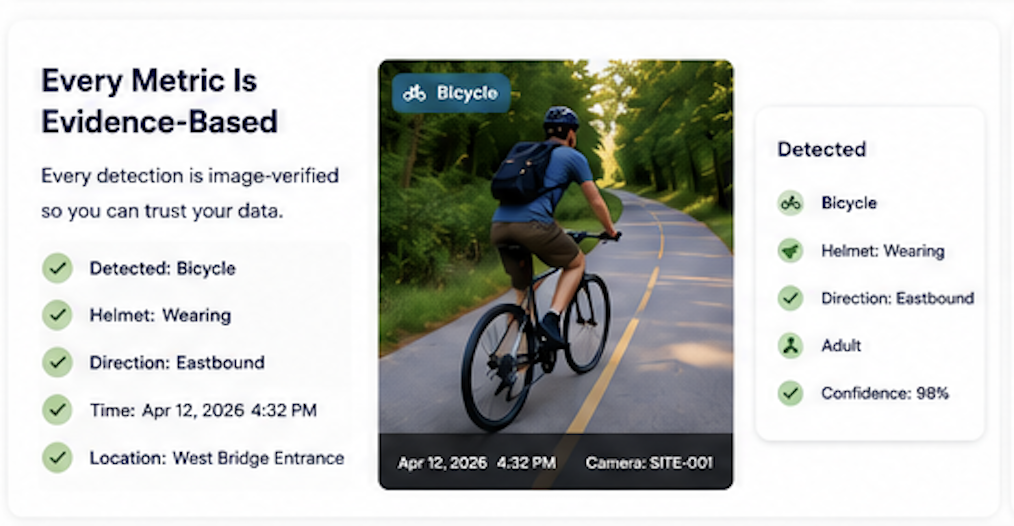
What the Data Looks Like
Every metric is evidence-based — each detection is image-verified and auditable.