Trailhead Demand & Congestion Analytics
Trailheads are where demand concentrates and conflicts surface. Measure how full each access point gets, when it fills, and which trailheads actually drive your system's usage.
Questions We Answer
Which trailheads are busiest?
When do they fill up?
Which access points drive the most usage?
Where should we add parking or capacity?
Are visitors redistributing after improvements?
How should wayfinding direct visitors?
What You Get
Peak fill times
Identify exactly when each trailhead reaches capacity, by day and hour.
Access-point comparison
Rank trailheads by demand to prioritize capital and capacity investments.
Arrival patterns
Understand visitor inflow and turnover throughout the day.
Defensible capacity data
Evidence to support parking, restroom, and infrastructure decisions.
Planning & Operations Applications
Parking & Access Planning
Trailhead activity often reveals more than trail counts alone — it's where demand concentrates, where lots overflow, and where the first conflicts of the day appear.
Waypoint helps agencies understand:
- Which trailheads are most heavily used
- When lots approach and exceed capacity
- Overflow and spillover parking patterns
- Access-point preferences across a network
- How demand redistributes after improvements
This data supports:
- Additional parking decisions
- Congestion mitigation
- Wayfinding and signage
- Access-point investment
- Restroom and amenity siting
Connecting Access Demand to Trail Usage
Because the same platform can watch both the lot and the trail, you can link parking occupancy directly to downstream activity — something a standalone counter or parking sensor can't do.
Relationships you can quantify:
- Parking occupancy vs. trail volume
- Arrival timing vs. peak trail use
- Turnover and dwell at the trailhead
- Network-wide demand distribution
Metrics We Capture
Every metric below is derived from image-validated detections — exportable and auditable, not modeled estimates.
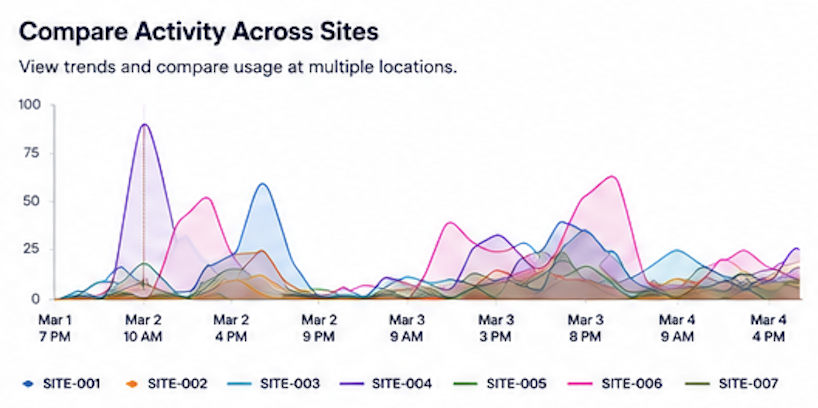
What the Data Looks Like
Compare activity across access points to see which trailheads drive usage.