Trail Activity Analytics
Know exactly how many people use each trail, what activities they're doing, and which direction they're traveling — measured continuously, without permanent infrastructure or field crews.
Questions We Answer
How many people are using this trail?
Are hikers, runners, or cyclists driving growth?
When are the peak days and hours?
Did our investment increase usage?
How does usage compare across trails?
What level of maintenance demand should we expect?
What You Get
Accurate user counts
Image-validated counts of every trail user, not estimated pulses from an infrared beam.
Activity classification
Distinguish hikers, runners, cyclists, equestrians, and skiers automatically.
Directionality
Travel direction for origin-destination and loop-vs-out-and-back analysis.
Trend tracking
Quantify seasonal change and the impact of investments over time.
Planning & Operations Applications
Trail Planning & Capital Improvements
The same dataset that tells you how busy a trail is tells you where to invest next. Continuous, classified counts turn anecdote and trail-day tallies into a defensible basis for capital planning.
Waypoint helps agencies understand:
- Which trail segments carry the most traffic
- Seasonal and weekly demand patterns
- User mix — walkers, runners, cyclists, equestrians
- Directional and origin-destination travel patterns
- How usage shifts after a trail improvement
This data supports:
- Trail expansion projects
- Surface and tread upgrades
- Bridge replacements
- Grant applications
- Long-range recreation planning
Why Traditional Trail Counters Fall Short
An infrared counter can tell you that something passed the beam. It cannot tell you much else — and it quietly miscounts groups, cyclists, and cold-weather traffic.
Conventional counters typically cannot tell you:
- What activity occurred
- Which direction the user traveled
- Whether a group passed together or as one count
- Whether the detection was even valid
Waypoint pairs automated analytics with image validation, so every count is classified, directional, and auditable — a richer and more defensible dataset for the decisions that follow.
Measuring the Impact of Investments
Capital projects are easier to fund and defend when you can show the before and after. Because Waypoint deploys in hours and runs continuously, you can baseline a segment, make the improvement, and quantify the change.
Common before/after measurements:
- Total visits before vs. after
- Shift in activity mix
- Change in peak-day and peak-hour demand
- Seasonal growth following an upgrade
Metrics We Capture
Every metric below is derived from image-validated detections — exportable and auditable, not modeled estimates.
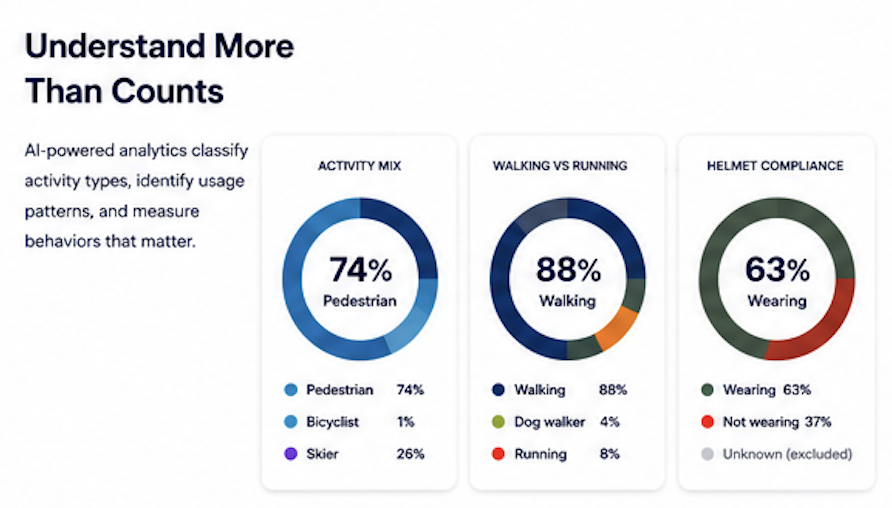
What the Data Looks Like
A sample of the activity-mix analytics Waypoint produces for a trail network.
Explore Trails
Hiking
Count hikers accurately, see exactly when trails peak, and quantify how foot traffic changes over time — the data agencies need to prioritize maintenance and protect sensitive areas.
Running
Distinguish runners from other trail users and understand when and where running activity concentrates — useful for event planning, route design, and managing shared-use conflict.
Cycling
Measure cyclist volumes, mode share, and travel direction on trails and bike paths — the evidence planners need to justify and prioritize cycling infrastructure.
Skiing
Measure winter trail and terrain use in conditions that defeat infrared counters — all-weather detection that keeps counting through snow, glare, and cold.