Cycling & Mountain-Bike Analytics
Measure cyclist volumes, mode share, and travel direction on trails and bike paths — the evidence planners need to justify and prioritize cycling infrastructure.
Questions We Answer
How many cyclists use this path?
What share of users are cyclists versus pedestrians?
Which direction do they travel?
Are bike volumes growing?
What We Measure
Cyclist classification
Count cyclists distinctly from walkers and runners.
Mode share
Quantify the cycling share of total trail activity.
Directionality
Directional flow for corridor and origin-destination analysis.
Growth tracking
Show how cycling demand changes over time.
Planning & Operations Applications
Justifying Bike Infrastructure
Cycling investment competes for limited capital, and 'people are riding here' rarely carries a budget conversation on its own. Classified cyclist counts and mode share replace that with a measured volume — how many riders, what share of total trail activity, and which direction they travel — giving planners the evidence to prioritize bikeways and defend them through review.
Evidence for:
- New or upgraded bike infrastructure
- Trail surfacing for cycling
- Mode-share and growth reporting
- Grant applications
Evaluating Trail Investments
A surfacing project, a new connection, or a network extension is far easier to justify — and to repeat — when you can show it changed behavior. Because Waypoint deploys quickly and runs continuously, you can baseline a route, make the improvement, and quantify whether ridership actually responded.
Assess the impact of:
- New trail and connectivity projects
- Surface and tread improvements
- Maintenance and reroute effectiveness
- Year-over-year ridership growth
Commute vs. Recreation
The same path can serve two completely different planning cases. Directional flow and time-of-day patterns separate weekday commuting from weekend recreation, so each demand profile can be understood and planned for on its own terms.
- Weekday commute peaks
- Weekend recreational peaks
- Directional flow by period
Metrics We Capture
Every metric below is derived from image-validated detections — exportable and auditable, not modeled estimates.
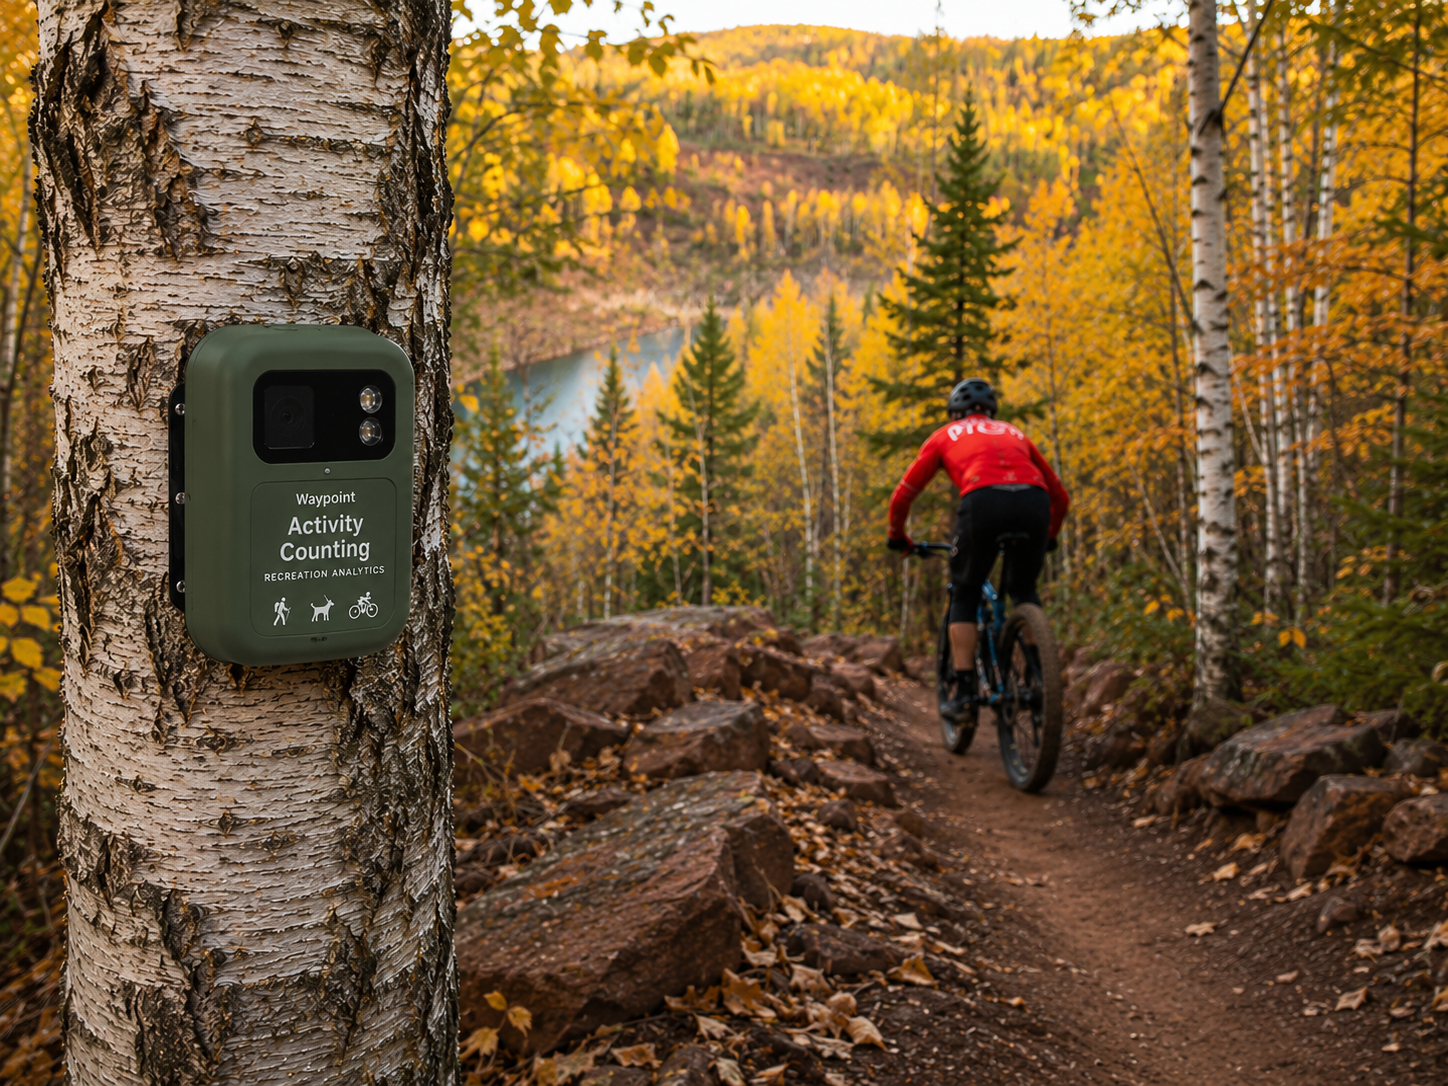
From Raw Image to Real-Time Insight
Solar-powered field stations capture imagery that our AI turns into clean, classified detections in seconds.