Shared-Use Path Analytics
Understand the mode split, volume, and directional flow on shared-use paths — the evidence to manage conflict, plan capacity, and design complete streets.
Questions We Answer
What is the mode split (walking, biking, other)?
How busy is the path by time of day?
Where and when are conflicts likely?
What is the directional flow?
What We Measure
Mode split
Separate pedestrians, cyclists, and other users.
Volume by time
Continuous counts across days and seasons.
Conflict-window insight
Identify when heavy mixed use raises conflict risk.
Directionality
Directional flow for capacity and design analysis.
Transportation & Planning Applications
Mode Split Analysis
The defining challenge of a shared-use path is that it serves several user types at once — pedestrians, runners, cyclists, and others — each moving at a different speed and with different expectations. Understanding that mix is the starting point for nearly every design and management decision, yet a simple passage count erases it. Waypoint classifies each user type, so the path's true composition is visible rather than averaged away.
Understand the mix of:
- Pedestrians
- Runners
- Cyclists
- Other users
Conflict & Capacity
Conflict on shared-use paths happens where heavy pedestrian and cyclist volumes overlap in time and space. Mode split, directional flow, and time-of-day data pinpoint when and where that overlap concentrates — turning a vague sense that 'the path feels crowded' into specific high-volume segments and conflict windows you can design around.
Identify:
- Peak congestion periods
- High-volume segments
- Likely user-conflict windows
- Capacity constraints
Complete Streets Planning
Volume, mode split, and directionality are the core inputs for capacity analysis and complete-streets design. Continuous, classified data gives corridor and safety projects a defensible foundation — and a baseline to measure improvements against.
- Corridor improvements
- Path widening
- Safety projects
- Transportation planning
Metrics We Capture
Every metric below is derived from image-validated detections — exportable and auditable, not modeled estimates.
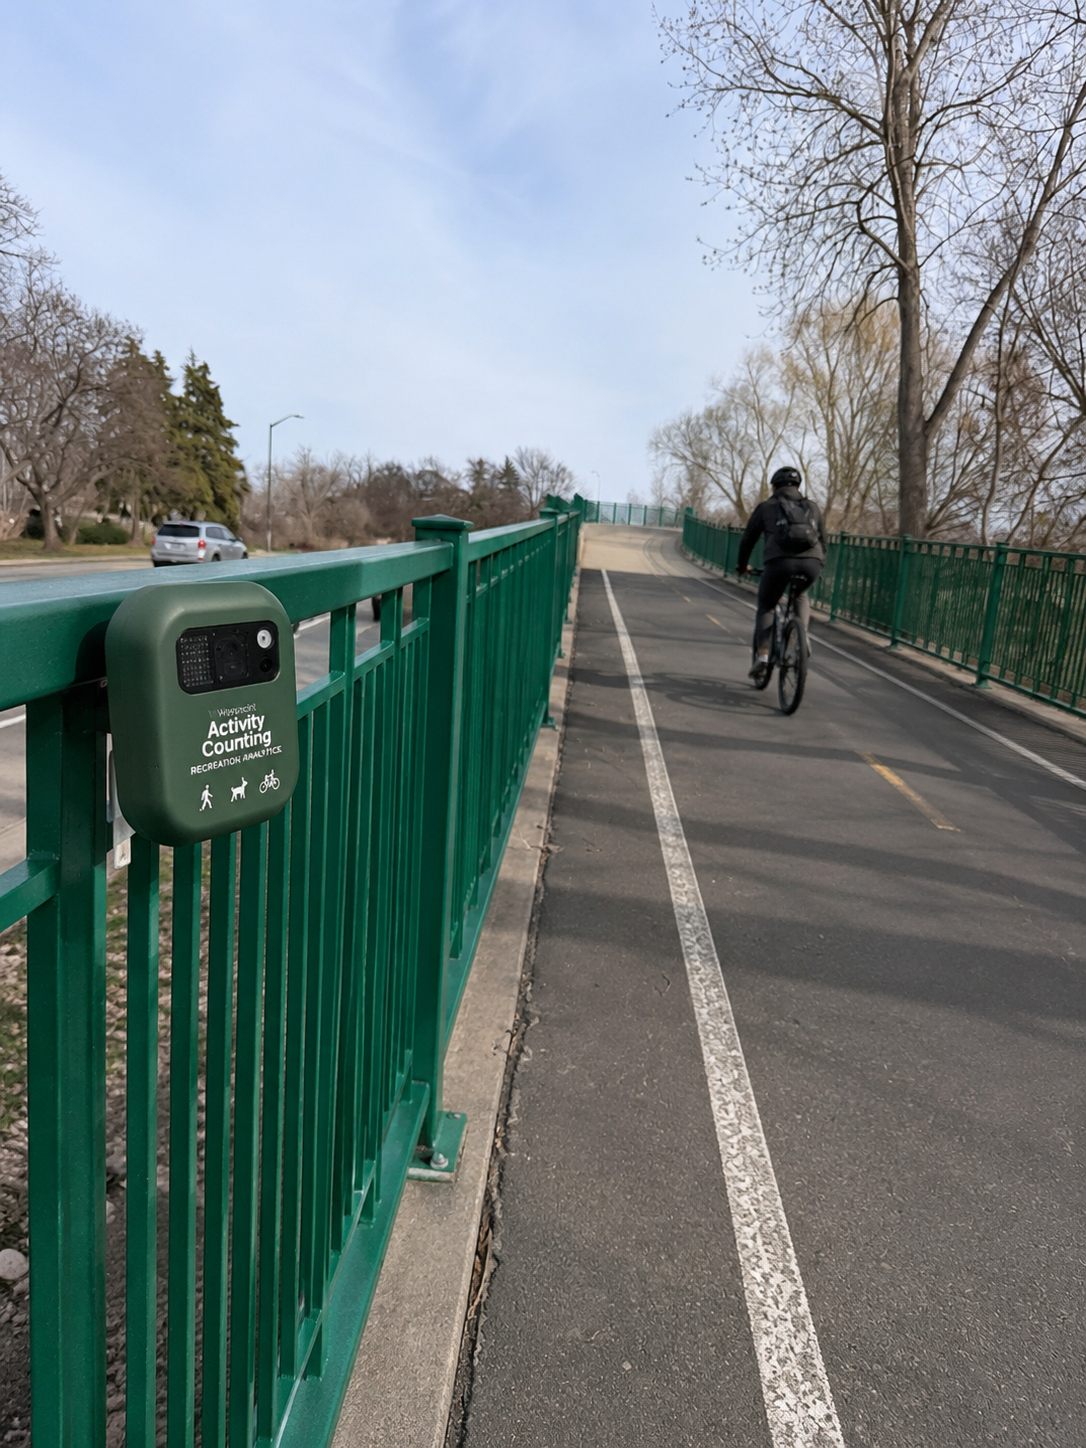
From Raw Image to Real-Time Insight
Solar-powered field stations capture imagery that our AI turns into clean, classified detections in seconds.