Bike Corridor Analytics
Measure cyclist volumes, directionality, and commute-versus-recreation patterns along corridors — the data planners need to prioritize and evaluate bike infrastructure.
Questions We Answer
How many cyclists use this corridor?
What is the directional flow?
How do commute and recreation peaks differ?
Is bike volume growing?
What We Measure
Cyclist counts
Accurate, classified counts of corridor cyclists.
Directionality
Directional flow for corridor planning.
Commute vs. recreation
Separate weekday commute peaks from recreational use.
Growth tracking
Show how cycling demand changes over time.
Transportation & Planning Applications
Transportation Insights
A bike corridor is a transportation facility, not just a recreation amenity, and it carries two distinct demand profiles on the same pavement. Directional, time-of-day counts separate the weekday commuter flow from weekend recreational riding, revealing peak travel periods and the directional balance that tube counters and manual counts miss. That distinction is the difference between planning for a commute corridor and planning for a recreational one.
Made visible:
- Commuter vs. recreational patterns
- Peak travel periods
- Directional flow
- Year-over-year growth
Infrastructure Evaluation
Corridor cyclist counts are the evidence base for prioritizing bikeways — and, just as importantly, for showing whether a completed project moved the needle. Because Waypoint runs continuously, you can baseline a corridor, build the protected lane or new connection, and quantify the change in ridership that followed.
Measure the impact of:
- Protected lanes
- New connections and trail extensions
- Safety improvements
- Mode-share and growth reporting
Supports:
- Corridor prioritization
- Before/after evaluation
- Grant applications
Metrics We Capture
Every metric below is derived from image-validated detections — exportable and auditable, not modeled estimates.
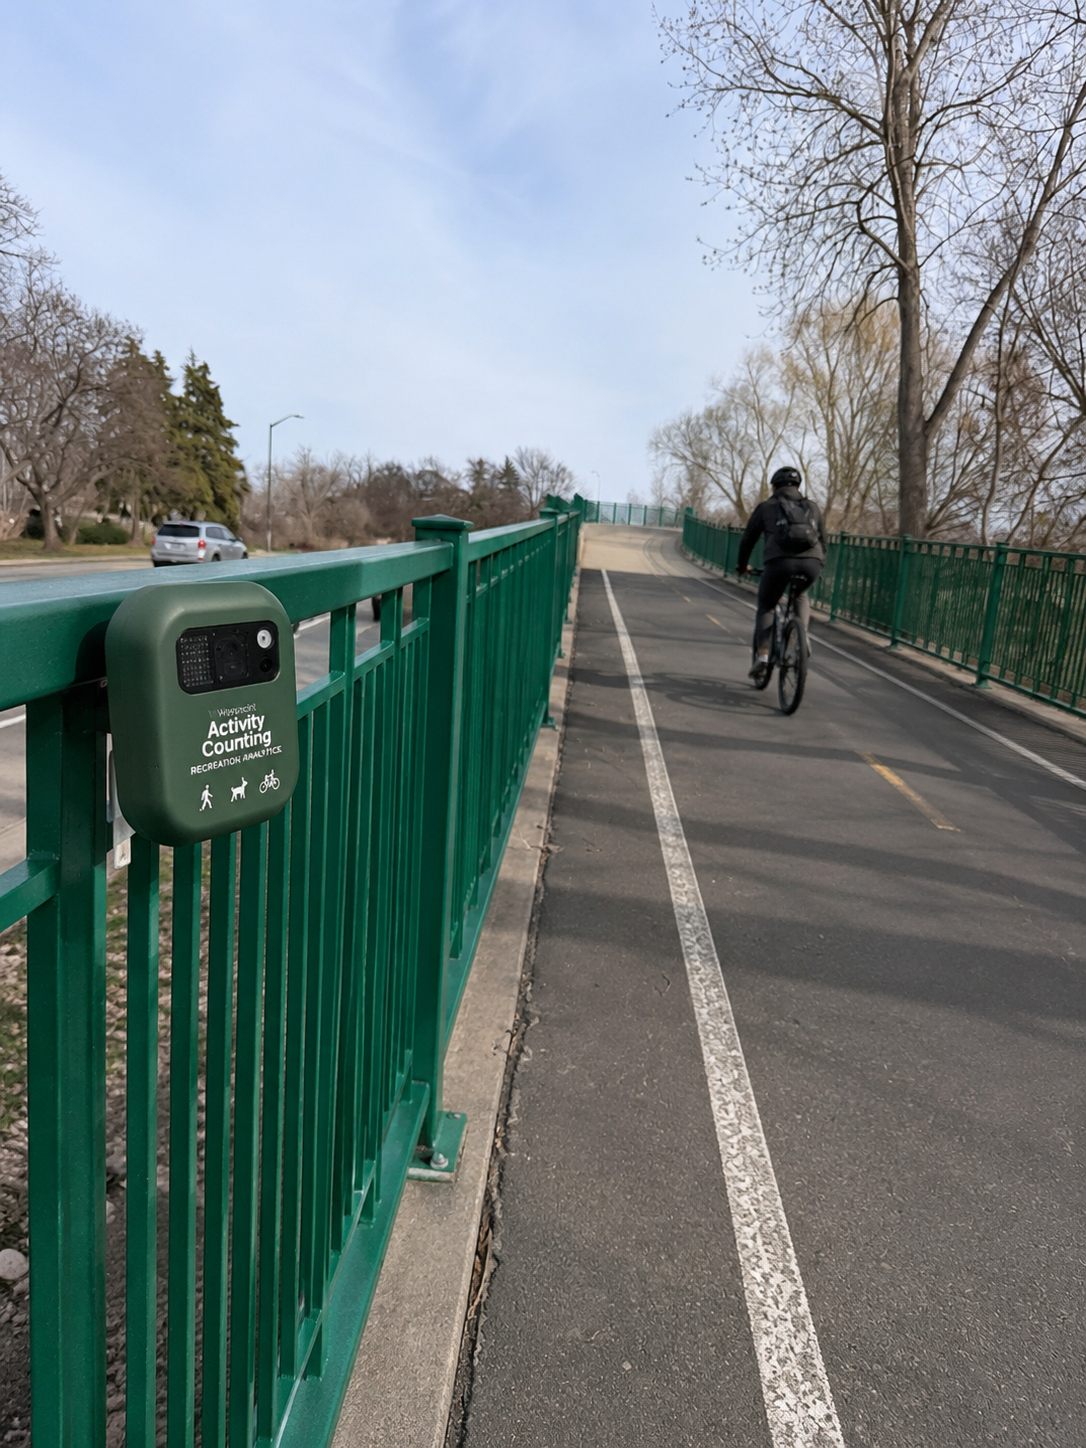
From Raw Image to Real-Time Insight
Solar-powered field stations capture imagery that our AI turns into clean, classified detections in seconds.