Recreation Facility Occupancy Analytics
From pickleball courts to boat launches, measure how heavily facilities are used and when. Turn occupancy data into defensible answers about how many courts, lanes, or launches you actually need.
Questions We Answer
How many pickleball courts do we need?
How heavily used are our courts and playgrounds?
When are facilities at capacity?
Where is demand outpacing supply?
Did a new or renovated facility change usage?
Which facilities serve the most residents?
What You Get
Occupancy tracking
Measure real utilization of courts, fields, playgrounds, and launches.
Capacity windows
See when facilities fill and how long peak demand lasts.
Demand vs. supply
Quantify whether a facility is over- or under-built for its demand.
Investment justification
Defensible data to support expansion, scheduling, and budgeting.
Planning & Investment Applications
Court & Facility Capacity Analysis
Occupancy data answers the question every parks board asks: do we have enough? Measure how often a facility is at capacity and for how long, instead of guessing from sign-ups or complaints.
Objective occupancy data helps answer:
- Are facilities operating at capacity?
- Which time windows see the greatest demand?
- Are additional courts or lanes justified?
- How do facilities compare across the community?
Before / After Investment Measurement
New courts, conversions, and renovations are easier to justify — and to evaluate — when you can compare utilization before and after.
Track across an investment:
- Occupancy and utilization rate
- Peak demand
- Seasonal growth
- Shift in user mix
Equity & Cross-Site Prioritization
Comparing demand across sites shows which facilities serve the most residents and which are under-used — the basis for equitable investment.
- Identify high-demand vs. under-used facilities
- Compare relative demand across a system
- Direct maintenance dollars to the busiest assets
Metrics We Capture
Every metric below is derived from image-validated detections — exportable and auditable, not modeled estimates.
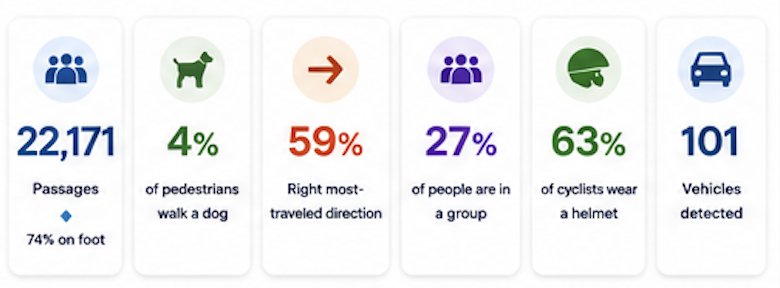
What the Data Looks Like
Headline metrics summarized from a recreation deployment.
Explore Recreation Facilities
Water Recreation
Measure how people use beaches, waterfronts, and water-access points — counts, activity types, and peak windows for paddling, swimming, and boating.
Pickleball
Pickleball demand is outpacing supply almost everywhere. Measure how heavily courts are used and when they're at capacity to answer, with data, how many courts your community actually needs.
Tennis
Understand how heavily tennis courts are used and when — the data to balance court allocation, plan conversions, and justify maintenance or expansion.
Skateparks
Measure how heavily a skatepark is used and when, so usage data — not anecdotes — informs programming, maintenance, and expansion decisions.
Playgrounds
Understand how much each playground is used and how sites compare — the data to prioritize maintenance dollars and justify renovations across a park system.
Boat Launches
Measure launch volume, peak congestion, and seasonal demand at boat ramps — the data to manage capacity, staffing, and access at busy water-access points.