Boat Launch Usage Analytics
Measure launch volume, peak congestion, and seasonal demand at boat ramps — the data to manage capacity, staffing, and access at busy water-access points.
Questions We Answer
How many launches happen per day?
When is the ramp busiest?
Is the launch over capacity?
How does demand change through the season?
What We Measure
Launch counts
Accurate daily counts of launches and trailers.
Peak windows
Identify the busiest launch periods.
Capacity & congestion
Quantify when the ramp exceeds capacity.
Seasonal trends
Track demand across the boating season.
Planning & Operations Applications
Measuring Demand at Waterfront Facilities
Boat launches experience highly concentrated, highly variable demand that occasional observation simply can't capture. Peak launch periods shift with the season, the weather, water levels, and local events, so a few site visits rarely reflect how a ramp actually performs. Continuous monitoring captures the full pattern across an entire season, giving agencies a complete picture of facility performance and visitor behavior.
Questions we help answer:
- When does congestion occur?
- Are additional launch lanes needed?
- Which facilities receive the most demand?
- How does weather affect usage?
Managing Ramp Capacity & Congestion
Launch ramps bottleneck on peak mornings, and queue formation at the water's edge is one of the most visible — and complaint-generating — capacity problems a parks or DNR operation faces. Daily launch counts and congestion windows let managers staff fee booths, time enforcement and maintenance, and size trailer parking around when the pressure actually occurs.
Informs:
- Staffing and fee-booth scheduling
- Enforcement and maintenance timing
- Parking and trailer-lot sizing
- Access and permit decisions
Supporting Waterfront Investments
Ramp expansions, parking improvements, dock replacements, and circulation upgrades require significant capital, and understanding how a facility is currently used is the foundation for evaluating them. Seasonal trend data supports capacity planning and makes the case for a second lane or expanded lot defensible.
- Daily and seasonal launch volume
- Peak-day demand
- Capacity and overflow events
Metrics We Capture
Every metric below is derived from image-validated detections — exportable and auditable, not modeled estimates.
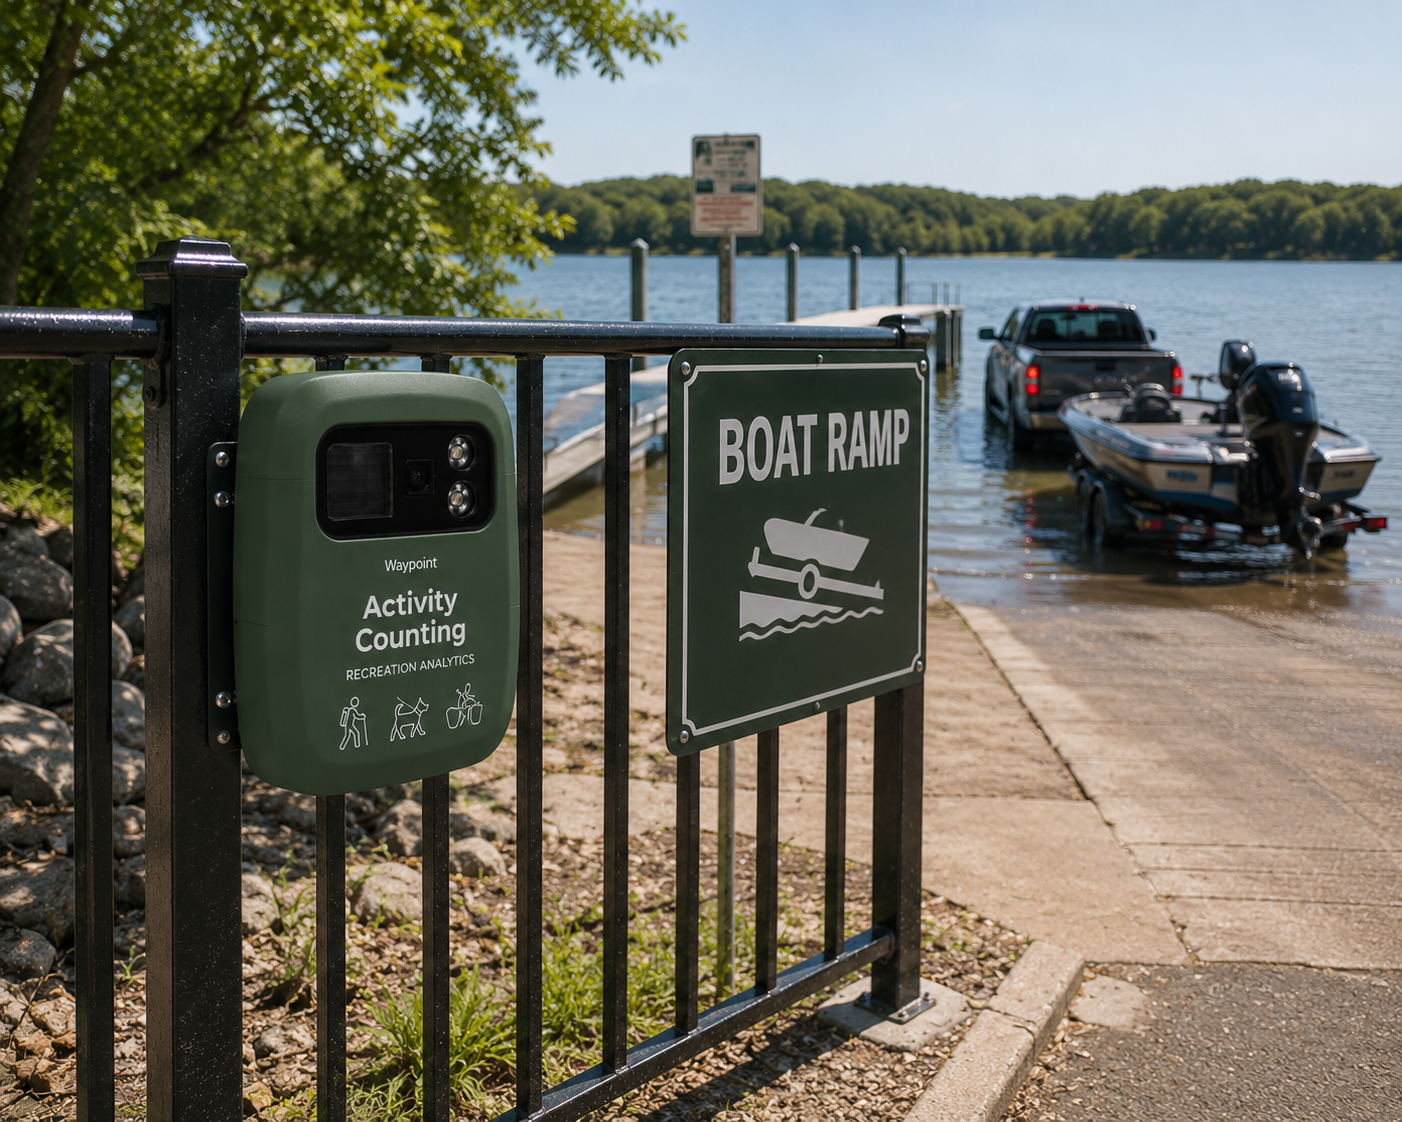
From Raw Image to Real-Time Insight
Solar-powered field stations capture imagery that our AI turns into clean, classified detections in seconds.