Water Recreation Analytics
Measure how people use beaches, waterfronts, and water-access points — counts, activity types, and peak windows for paddling, swimming, and boating.
Questions We Answer
How many people use this water-access point?
When is the beach or launch busiest?
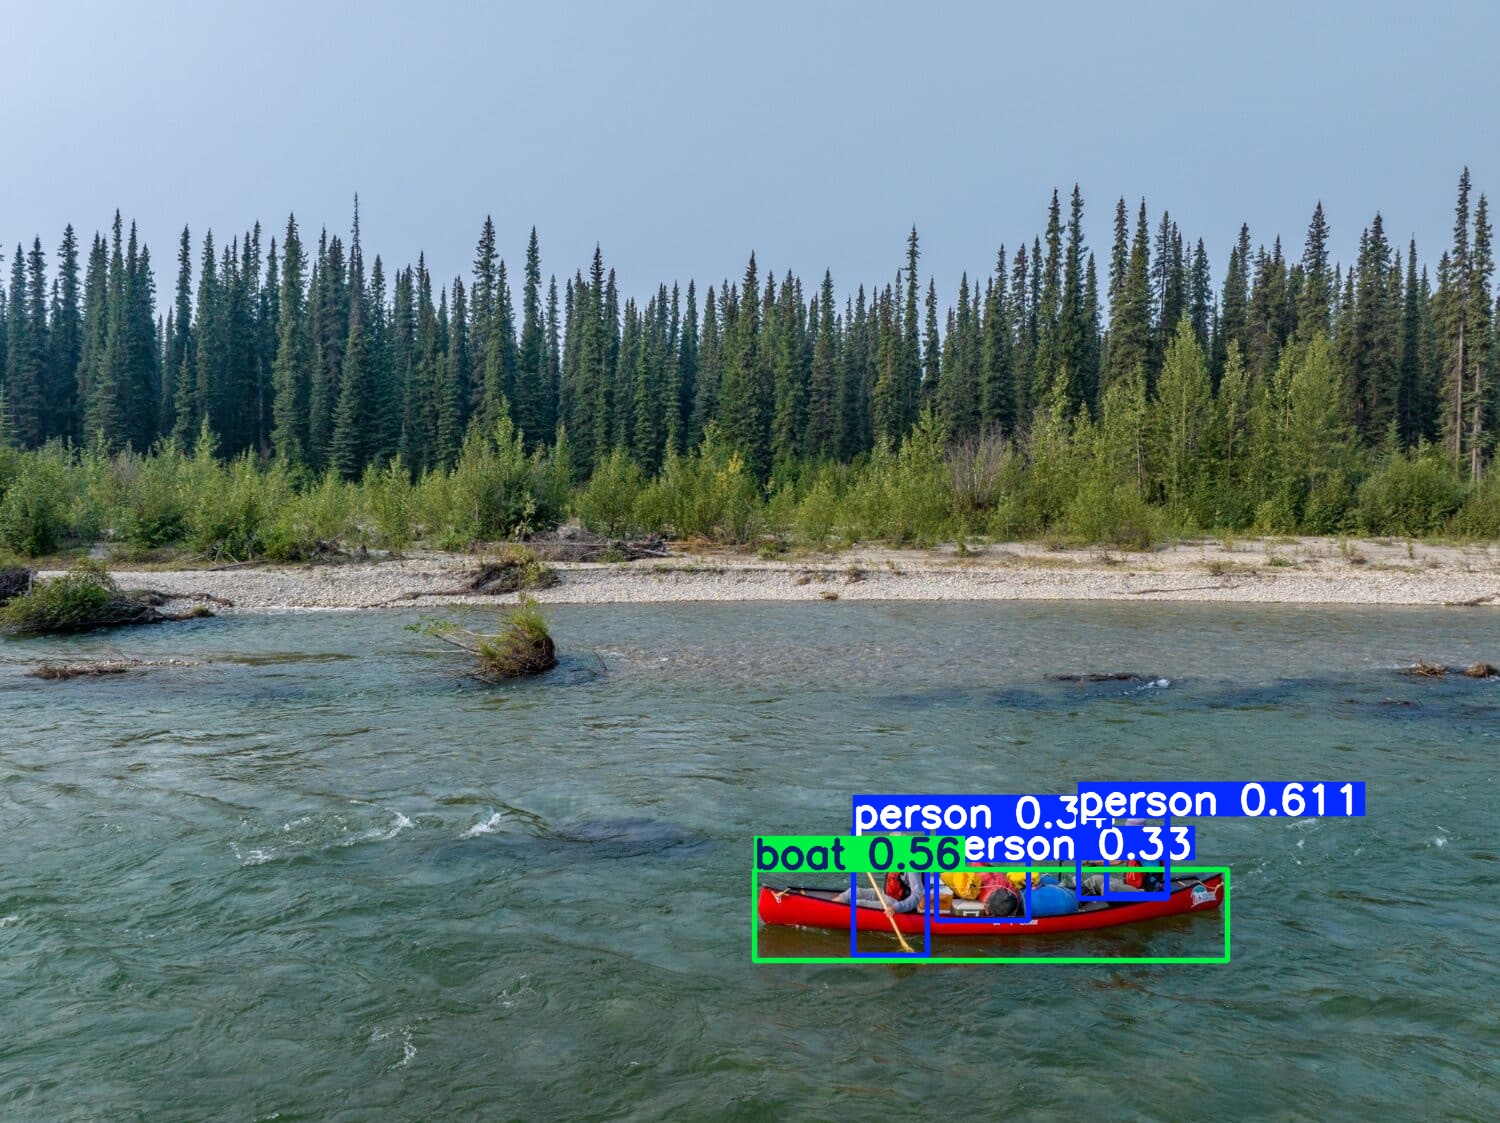
What activities are happening on the water?
How does water use change seasonally?
What We Measure
Water-access counts
Accurate counts at beaches, launches, and access points.
Activity classification
Distinguish paddling, swimming, and boating activity.
Peak windows
See when waterfronts reach their busiest.
Seasonal trends
Track demand across the recreation season.
Planning & Operations Applications
Waterfront Demand
Waterfronts are among the most variable assets a park system manages — a beach that is nearly empty on a cool morning can surge past capacity by mid-afternoon on a hot weekend. Continuous counts and activity classification turn that volatility into a measured demand profile, showing not only how busy the waterfront gets but what people are actually doing there: swimming, paddling, fishing, or launching.
Measured at the waterfront:
- Beach and shoreline activity
- Paddling and boat-access demand
- Swimming vs. boating vs. paddling mix
- Seasonal and peak-window patterns
Managing Waterfront Capacity & Safety
Because waterfront demand concentrates into narrow windows, staffing it efficiently is hard — and the cost of getting it wrong is measured in either idle payroll or thin coverage on the busiest, highest-risk afternoons. Peak-window data lets agencies align lifeguarding, restroom servicing, and parking with when the waterfront is genuinely busy.
Informs:
- Lifeguard and staff scheduling
- Restroom and amenity capacity
- Parking and access at the waterfront
- Permit and event planning
Operational & Seasonal Planning
Waterfront use rises and falls sharply across the season and with the weather. Trend data supports the longer-horizon decisions — when to open and close facilities, where to add amenities, and how to plan maintenance around demand rather than into it.
- Seasonal demand trends
- Weather-correlated usage
- Facility and amenity prioritization
Metrics We Capture
Every metric below is derived from image-validated detections — exportable and auditable, not modeled estimates.
From Raw Image to Real-Time Insight
Solar-powered field stations capture imagery that our AI turns into clean, classified detections in seconds.