Waypoint Cloud Platform
Command center for recreation telemetry.
The Waypoint Cloud Platform is where recreation data becomes insight. Organizations use the platform to manage monitoring projects, configure sensor stations, explore recreation activity patterns, and audit AI-generated detections. The platform combines spatial mapping, dynamic dashboards, and transparent data auditing into a single system designed for outdoor infrastructure monitoring.
Organize Monitoring Projects
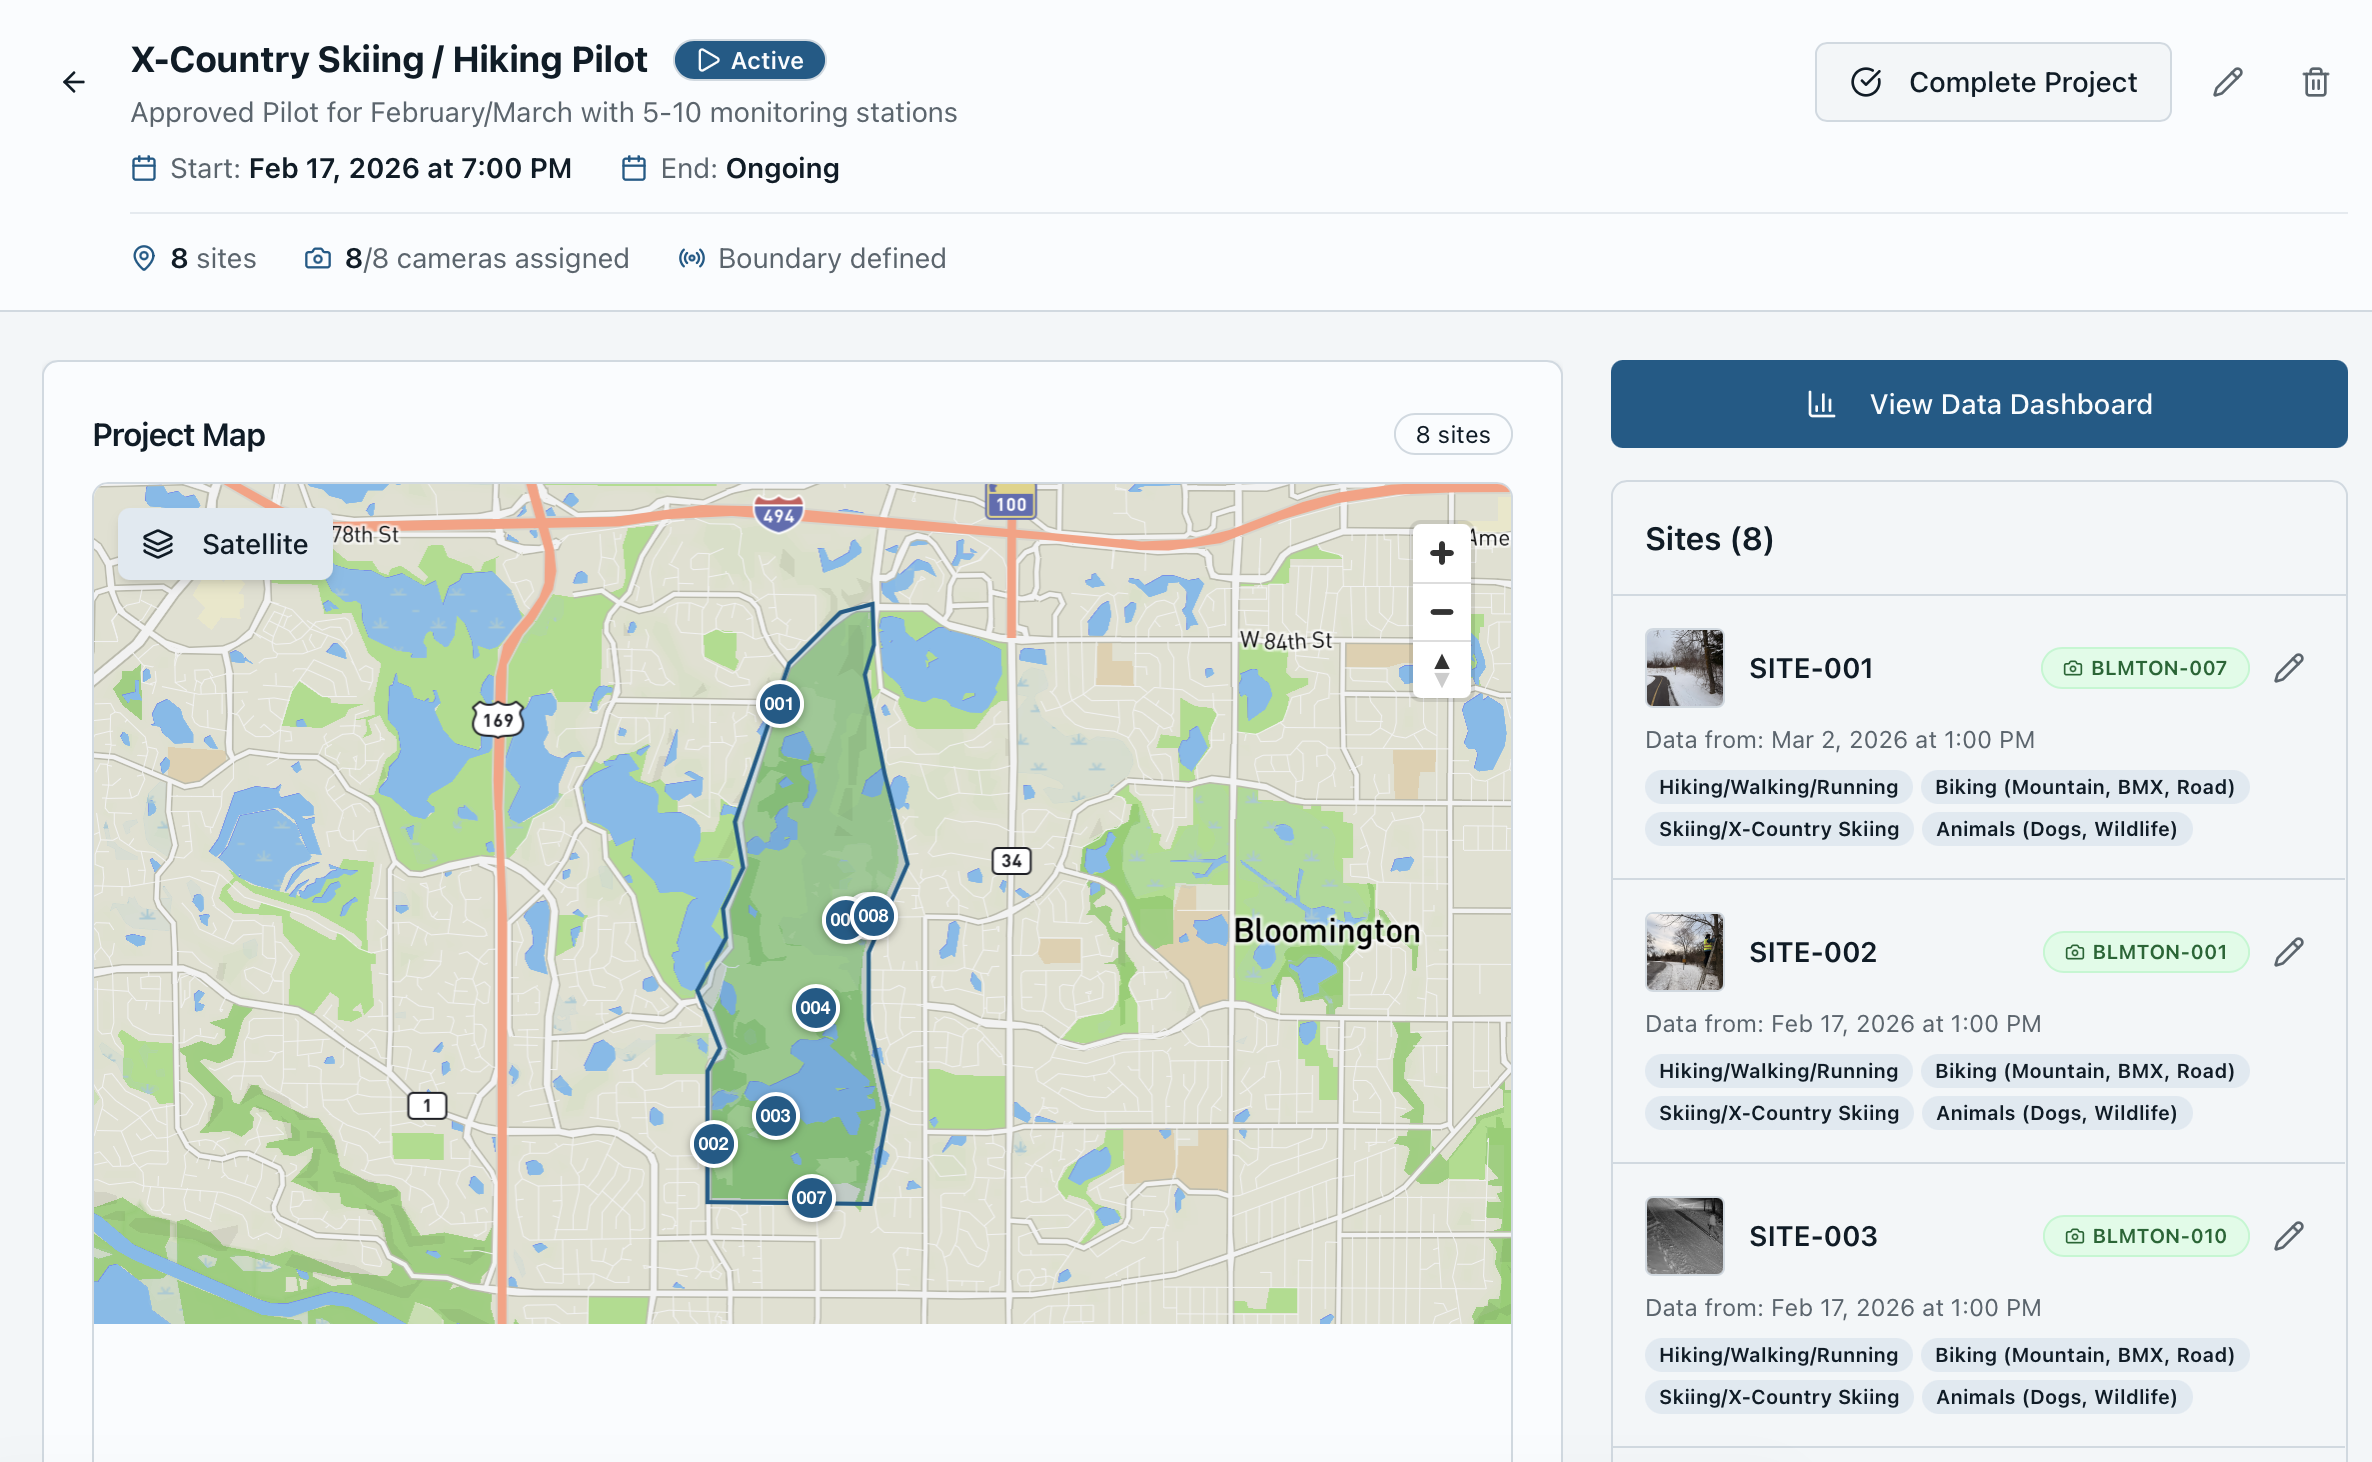
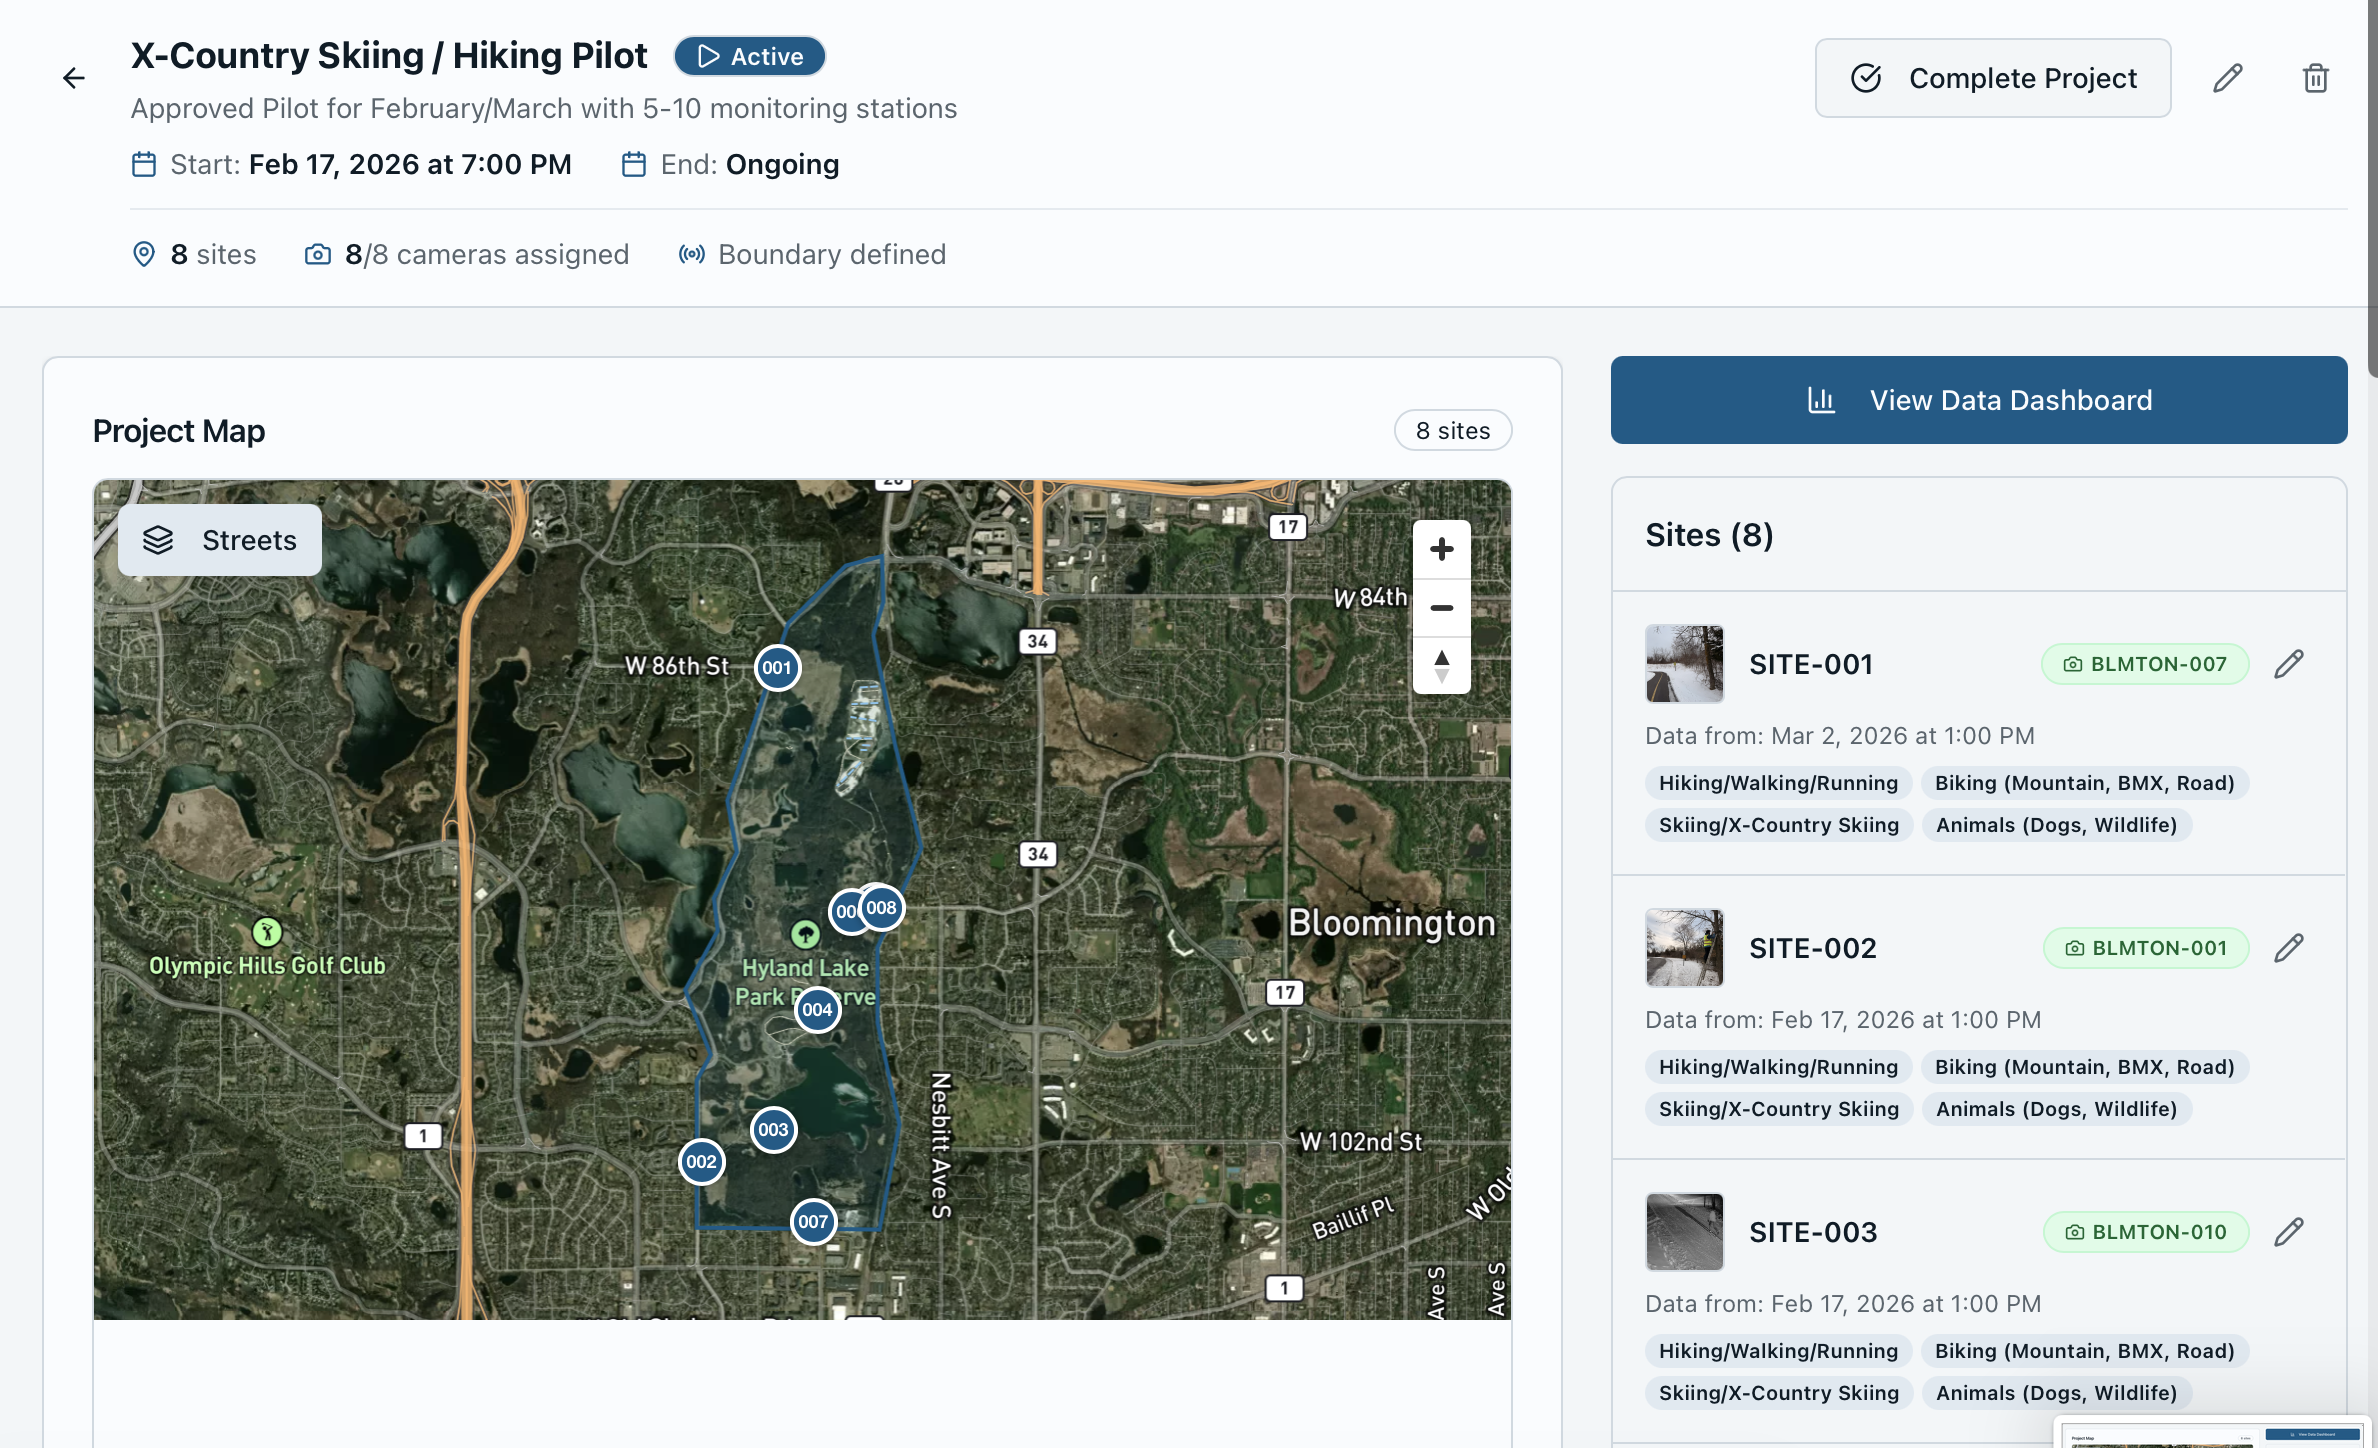
Monitoring efforts are organized into projects. Projects represent a monitoring initiative or study—whether monitoring all trailheads in a park, analyzing recreation patterns along a river corridor, or measuring activity across a regional trail system.
Each project aggregates data from multiple monitoring stations and provides a centralized dashboard for analyzing recreation activity across an entire study area.
Example Monitoring Projects
- •Monitoring all trailheads in a park system
- •Analyzing recreation patterns along a river corridor
- •Measuring activity across a regional trail network
Configure Monitoring Stations
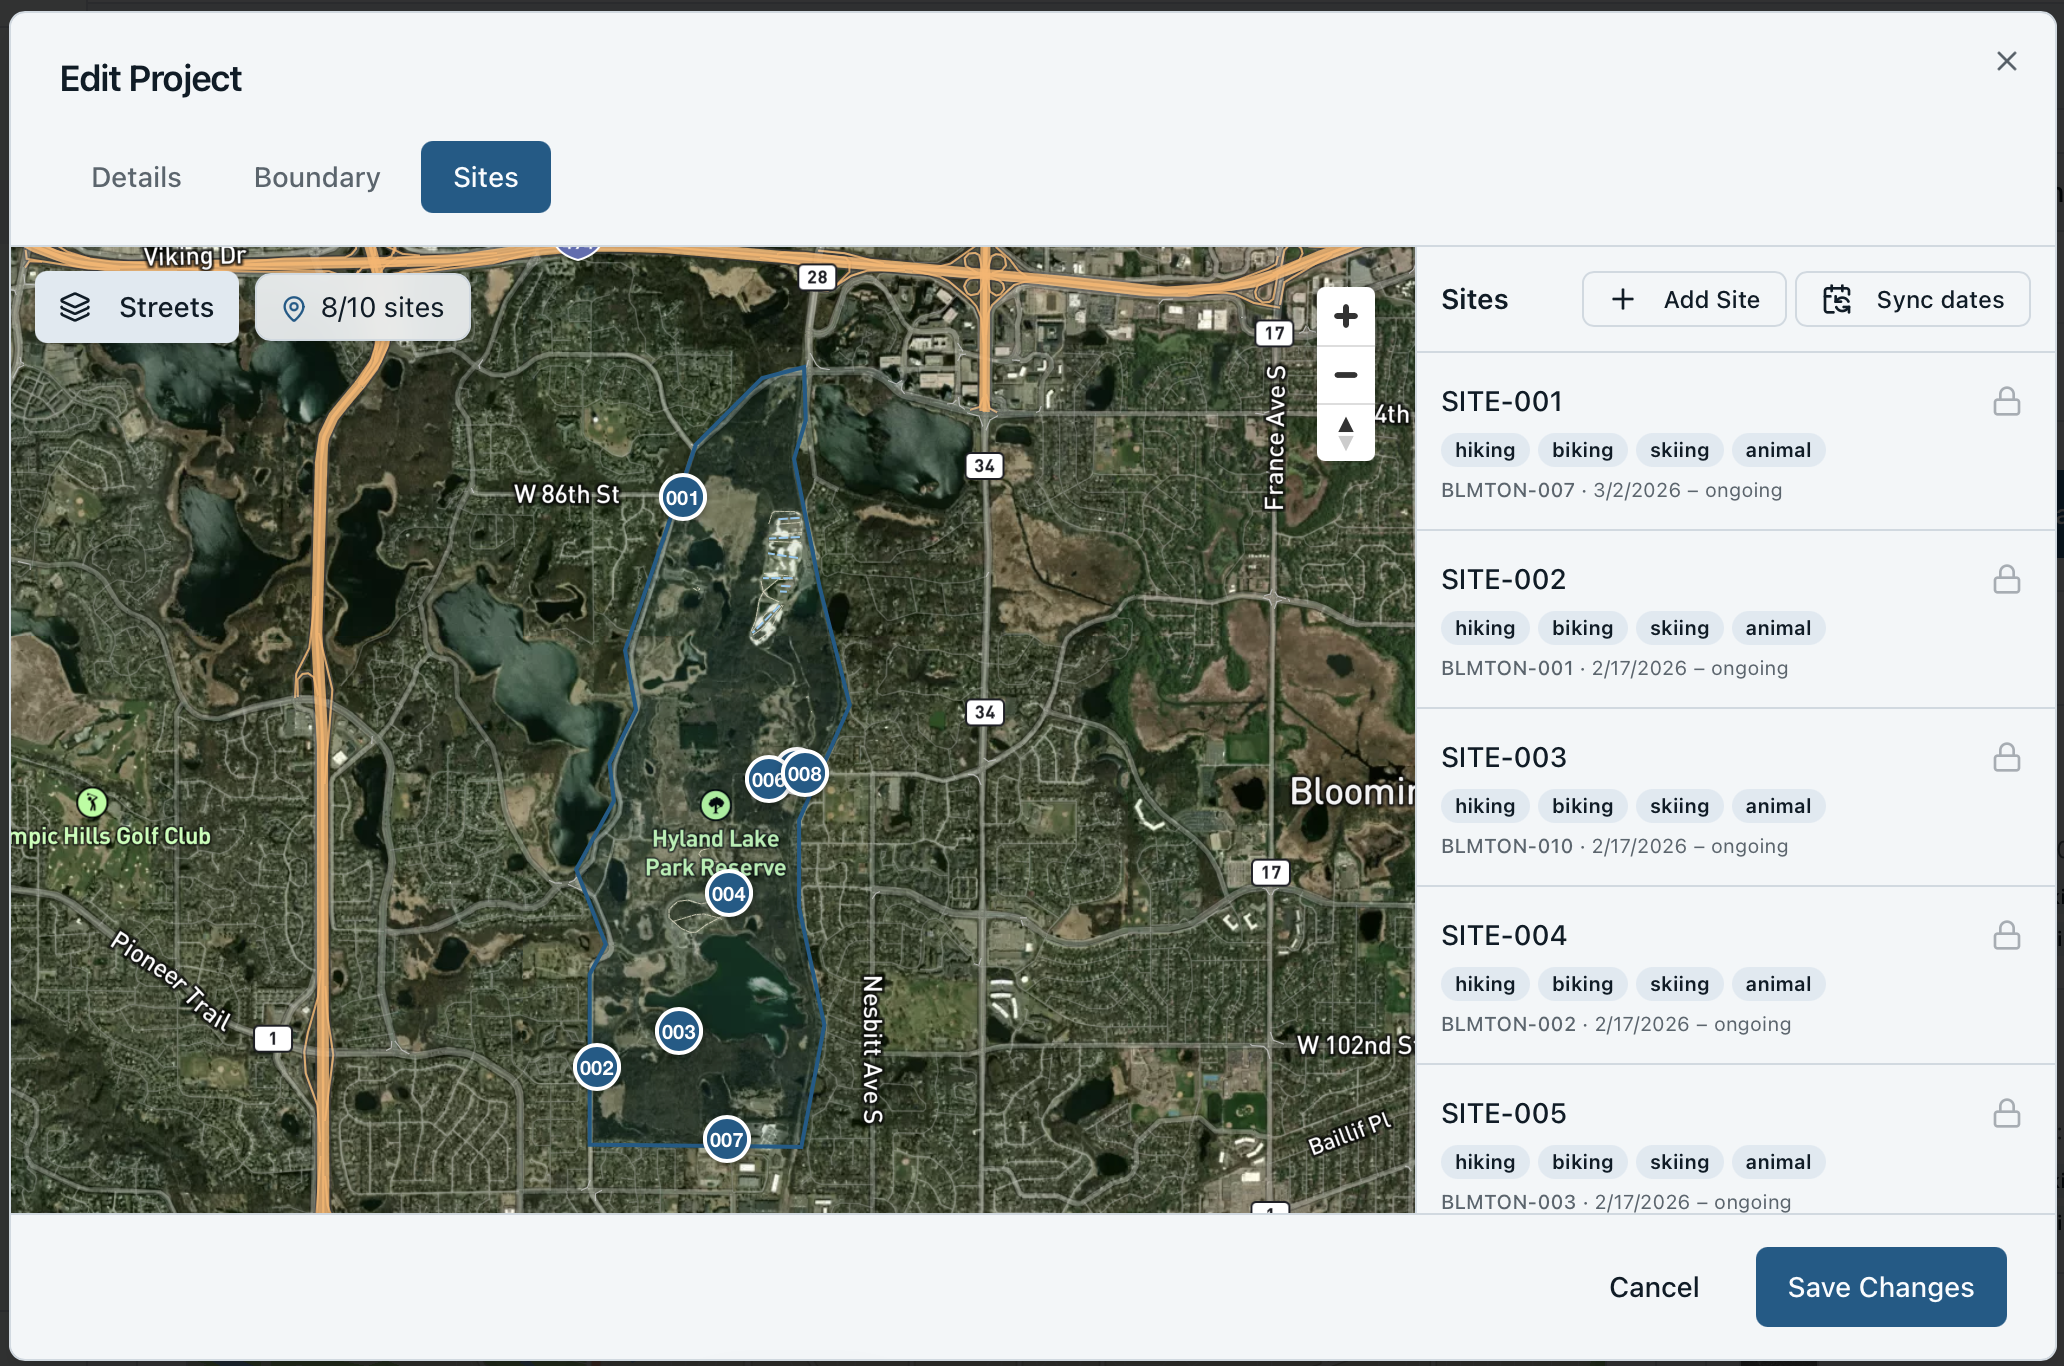
Stations are geo-located monitoring locations where recreation activity is measured. Within each project, users can create and configure stations with specific monitoring goals tailored to site-specific requirements.
Station Configuration Options
- •Counting people
- •Counting bikes
- •Detecting vehicles
- •Detecting animals
- •Direction-of-travel detection
- •Duplicate visit filtering
- •Site-specific detection settings
Stations can also include metadata about the monitoring site, such as trail names, park areas, or access point descriptions, making it easier to organize and analyze data at scale.
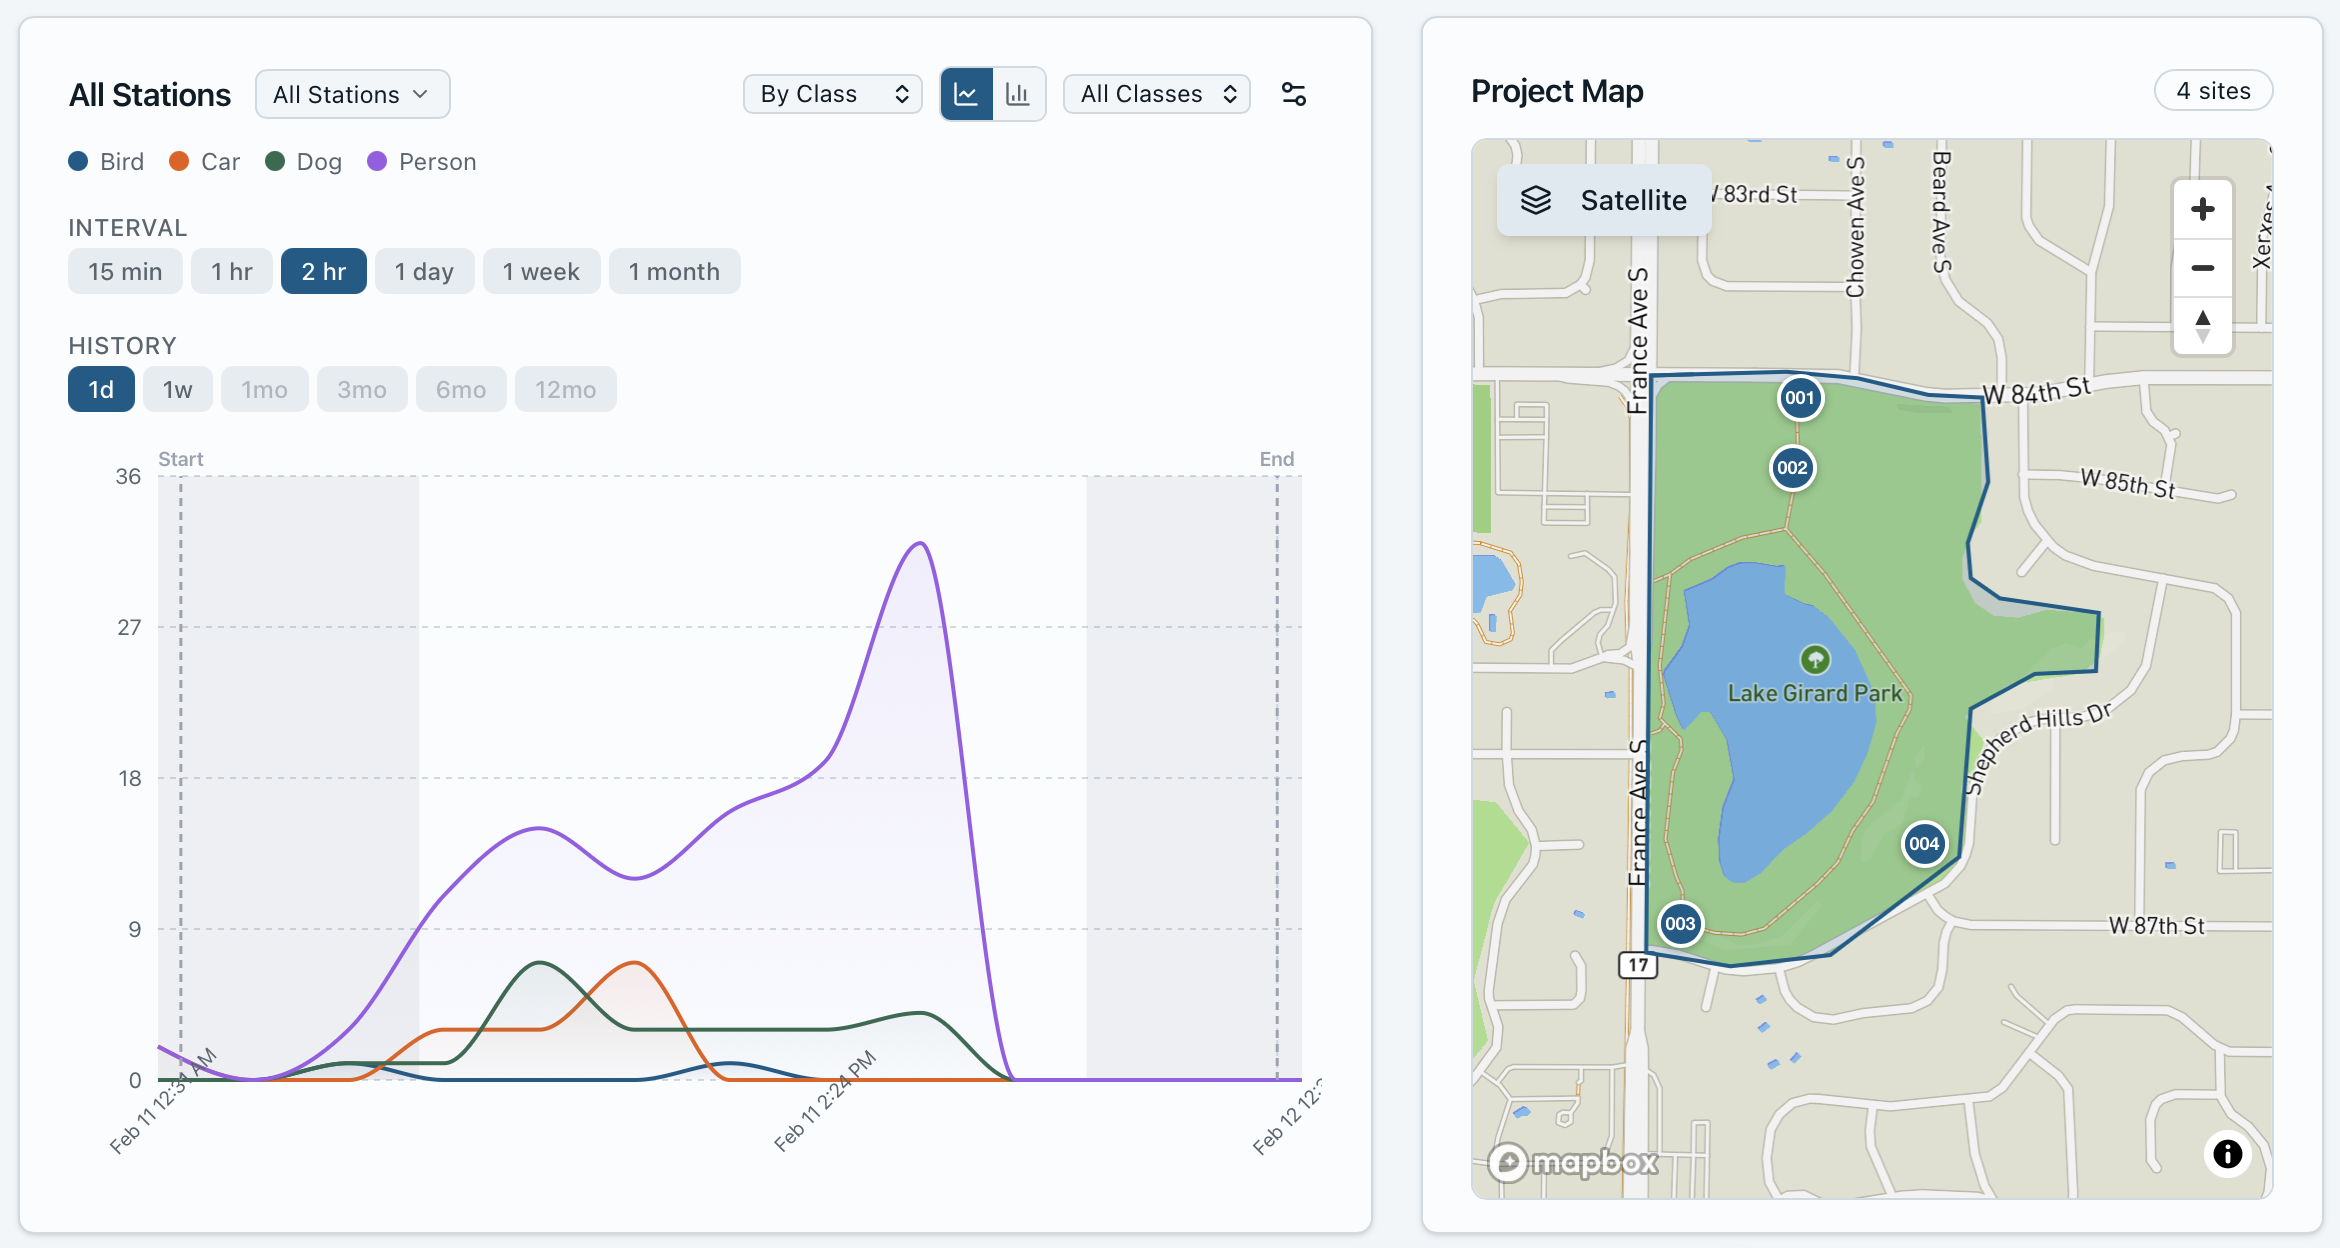
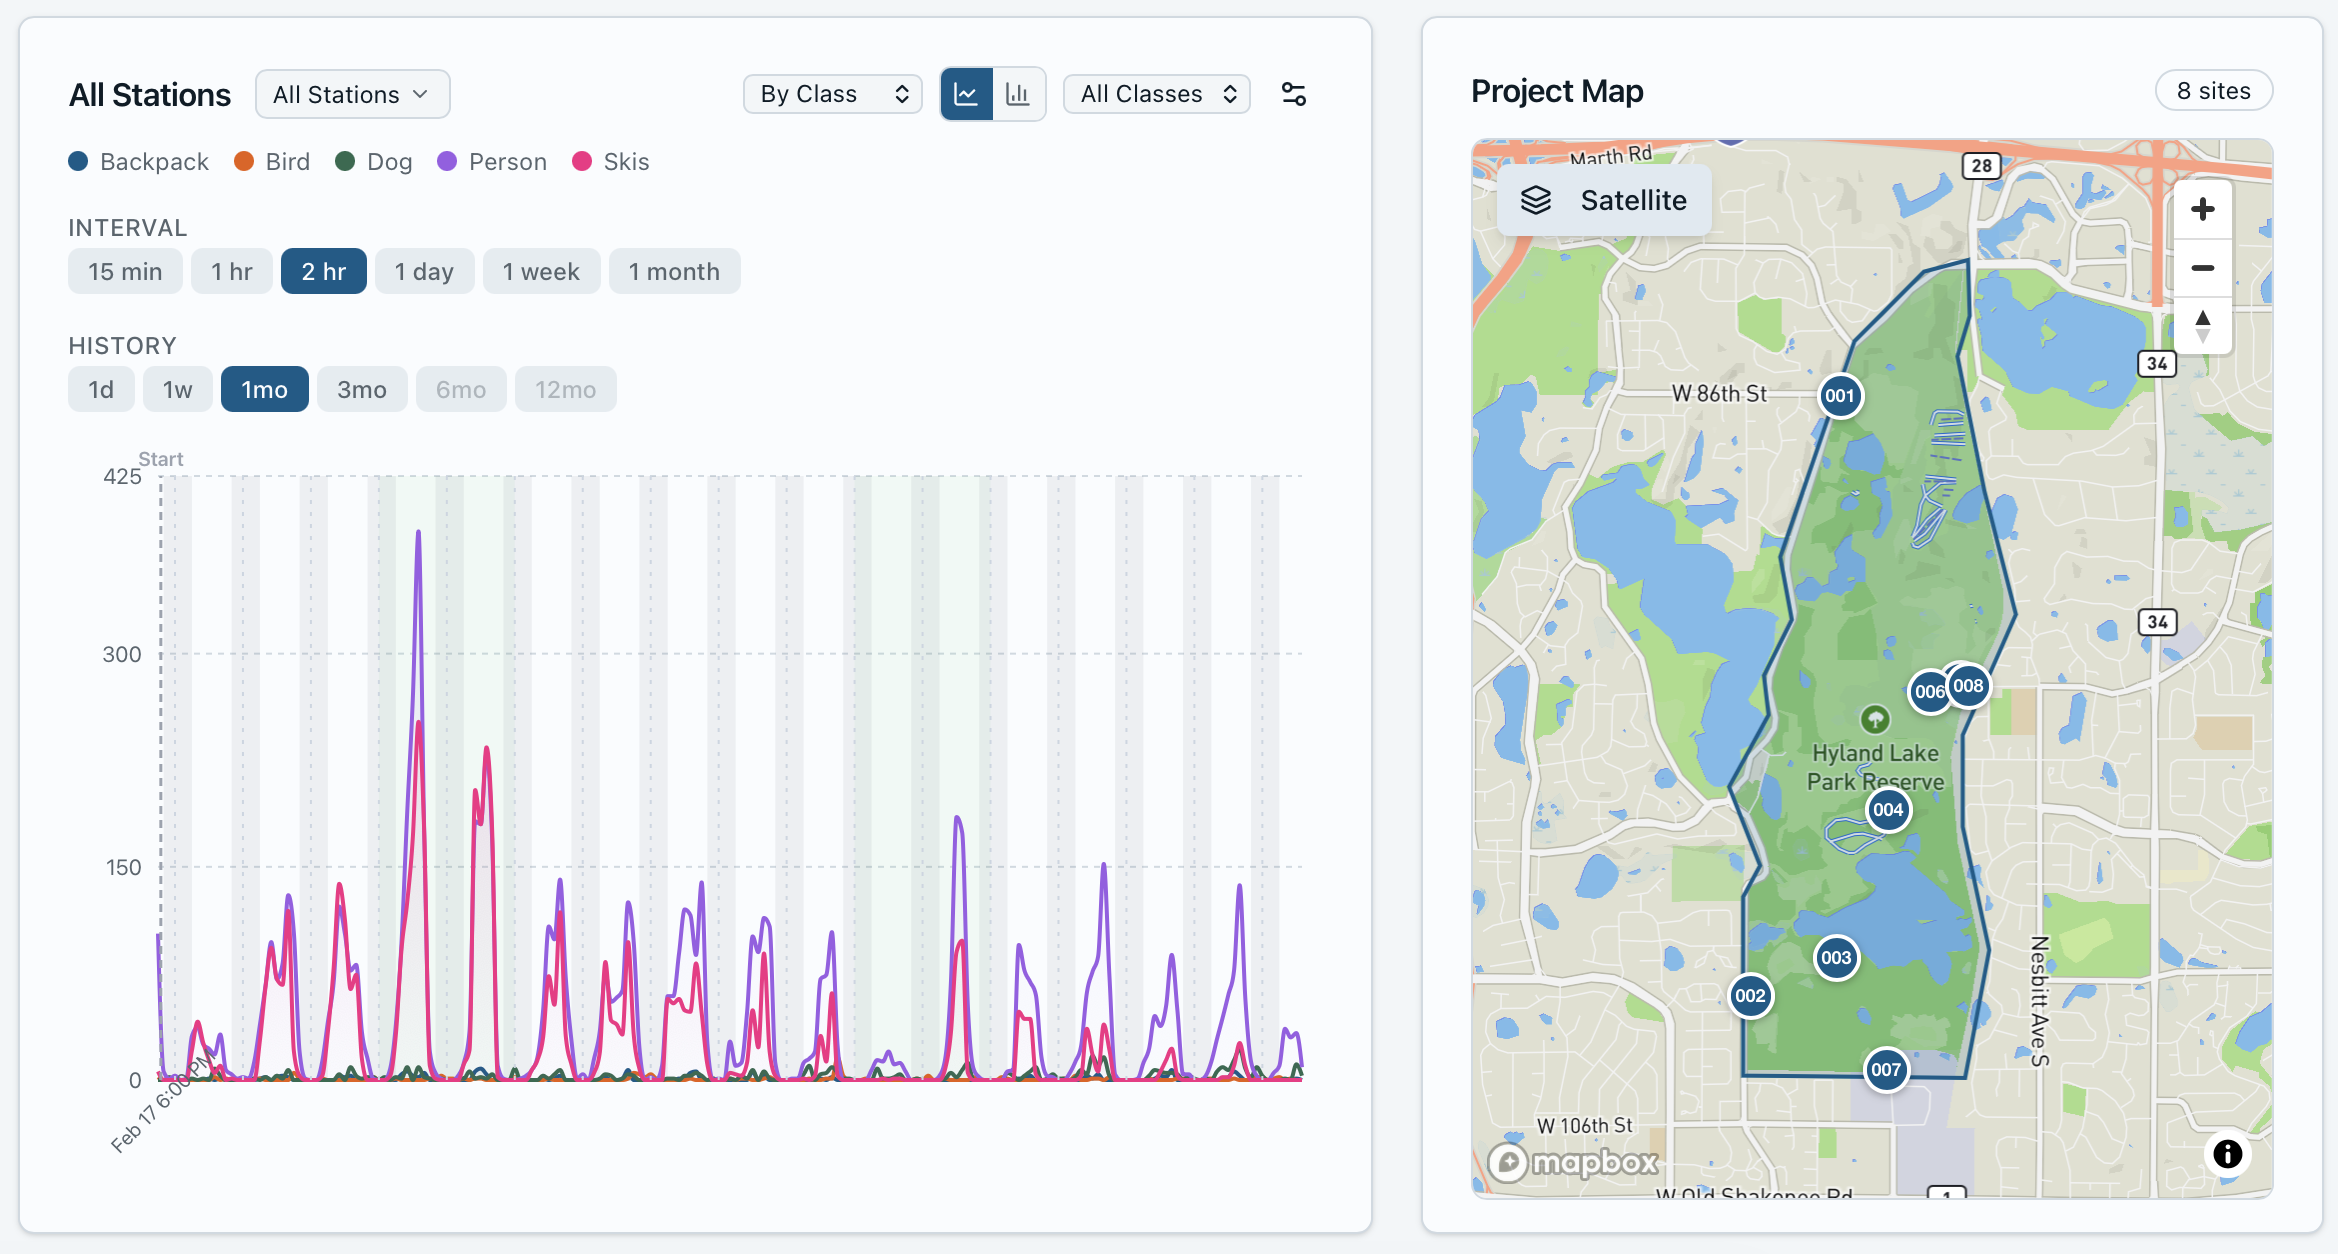
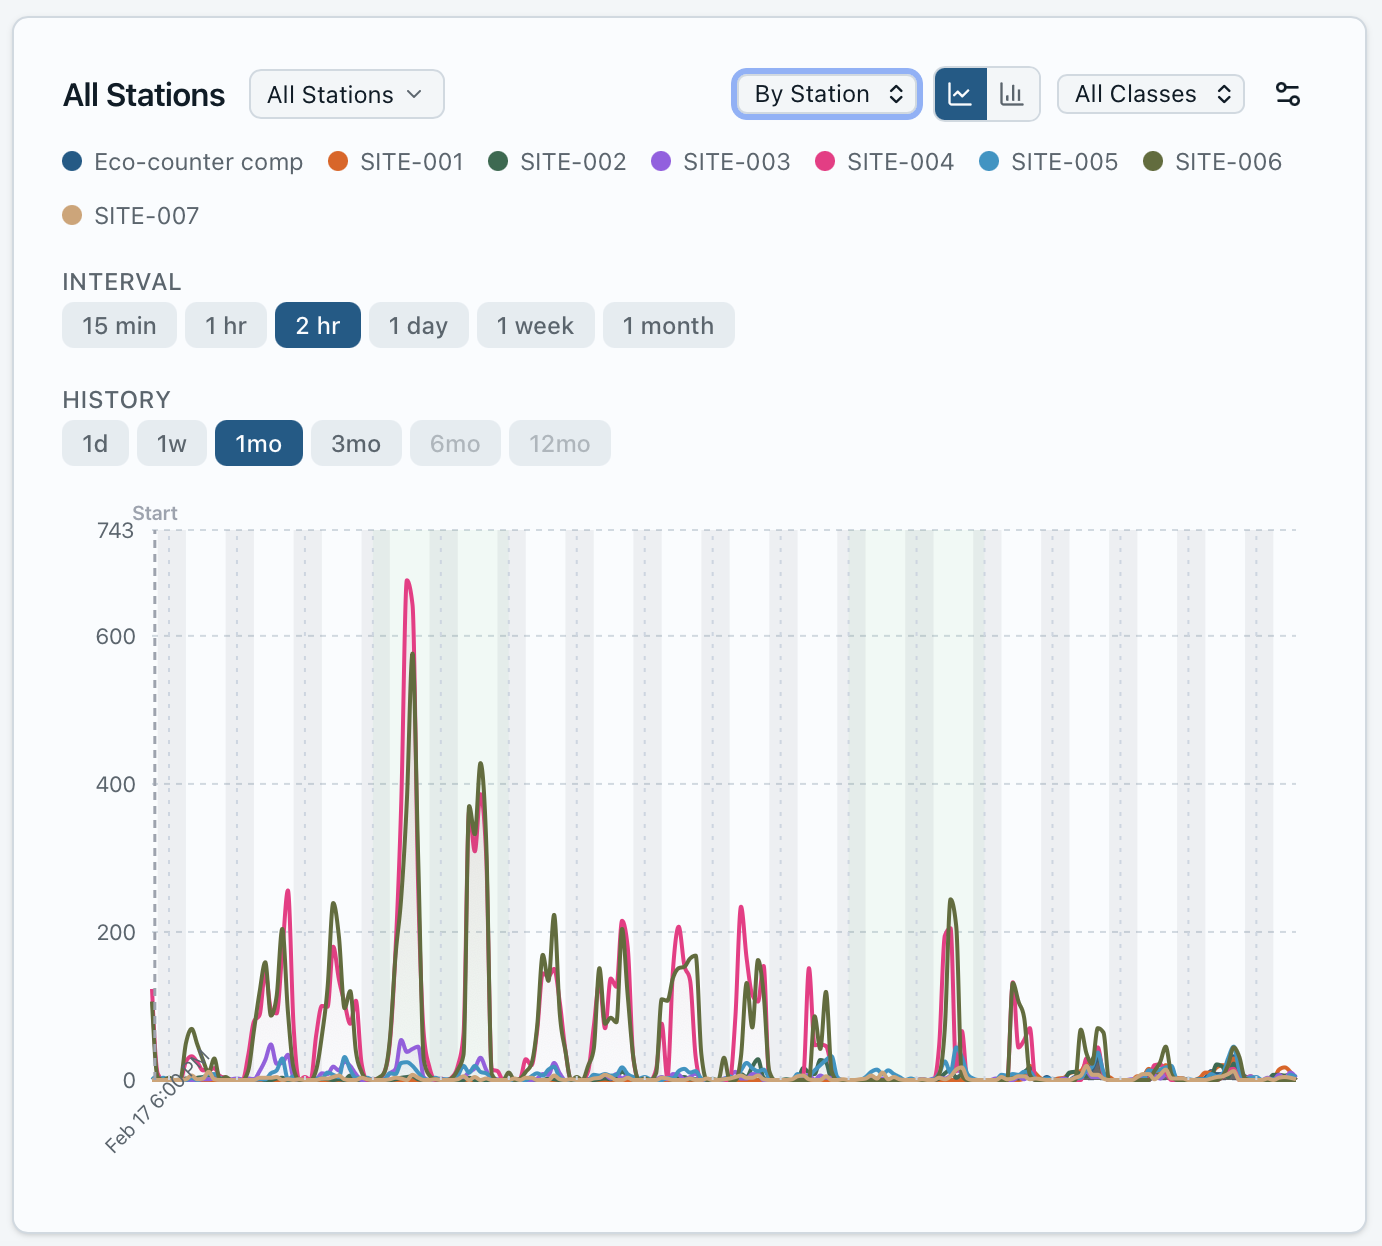
Dynamic Recreation Data Dashboards
Each project includes a powerful analytics dashboard for exploring recreation patterns. Dashboards visualize activity across time and space, allowing users to explore recreation activity at multiple time scales—including intervals as small as 15 minutes.
Viewing activity trends over time
Analyze daily, weekly, monthly, and seasonal patterns to understand how recreation demand changes throughout the year.
Comparing different recreation classes
Compare activity types side-by-side—such as people vs dogs, bikes vs skis, or pedestrians vs vehicles—to understand multimodal trail usage.
Comparing multiple monitoring sites
See how traffic varies across different access points, trailheads, or park areas within a single monitoring project.
Analyzing activity patterns throughout the day
Understand hourly usage patterns to identify peak periods, optimize staffing, or inform infrastructure planning.
Identifying peak usage periods
Detect high-traffic periods at hourly, daily, or seasonal resolution to inform operations and capacity management.
The dashboards make it easy to understand how recreation patterns evolve across an entire park or trail system, enabling data-driven decision-making for land management and planning.
Compare Sites and Activity Types
The platform allows side-by-side comparisons across monitoring sites and activity types, helping land managers understand how recreation demand varies across different access points and infrastructure.
Comparing traffic at multiple trailheads
Identify which access points receive the most traffic and how usage varies across different entry points to a trail network.
Comparing weekend vs weekday usage
Understand temporal usage patterns and how visitor behavior differs between weekends and weekdays.
Analyzing seasonal recreation trends
Track how usage evolves across seasons—such as summer hiking vs winter skiing—to inform seasonal operations.
Comparing activity types
Compare walkers, cyclists, and skiers to understand multimodal trail usage and identify potential conflicts or capacity constraints.
Directional Activity Analysis
For stations configured with direction detection, the platform can visualize movement patterns and flow. This allows organizations to understand how people move through recreation infrastructure.
Inbound vs outbound trail traffic
See how many users enter versus exit at specific access points to identify usage asymmetries and flow patterns.
Directional flow on linear trails
Understand dominant travel directions on point-to-point trails or greenways to inform trail design and wayfinding.
Usage patterns at trail intersections
Analyze movement patterns at trail junctions and decision points to understand route preferences.
Directional insights can help planners better understand circulation patterns and inform decisions about trail routing, signage, and infrastructure placement.
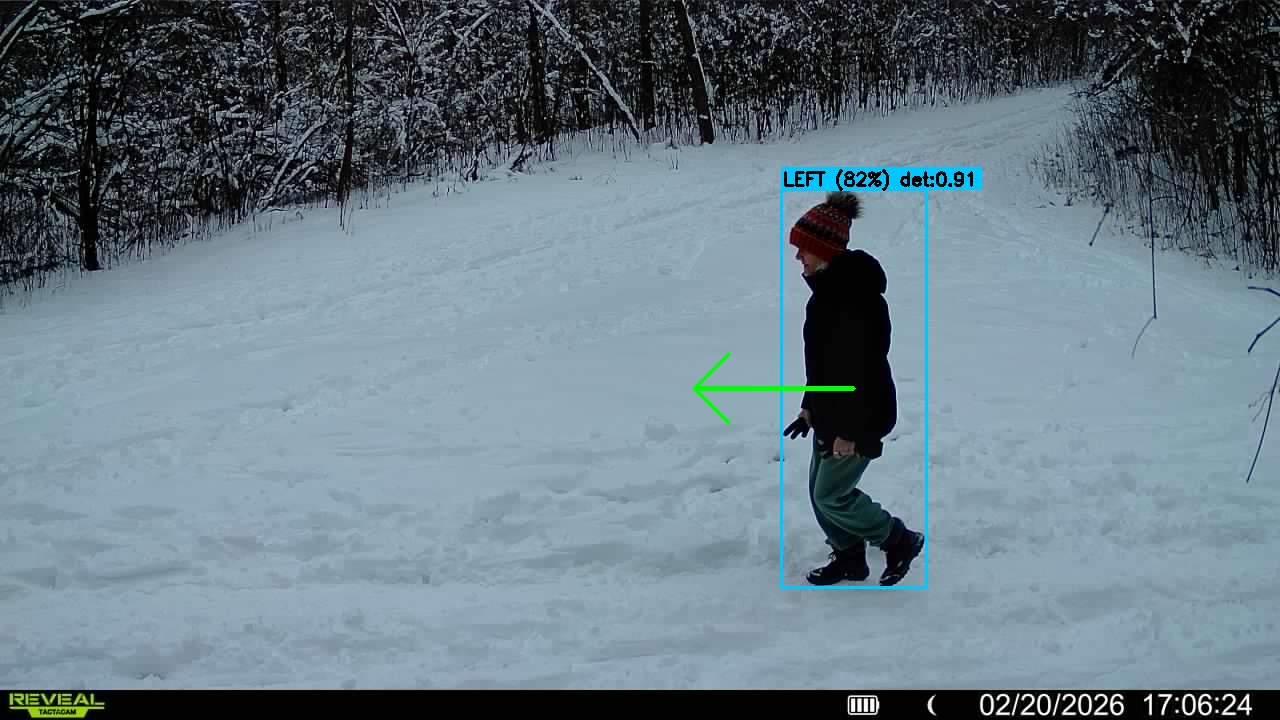
Auditable AI Data
Waypoint's vision-based system allows data to be audited. Every data point in the dashboard can be traced back to the original detection events, providing full transparency into how counts are generated.
Users can click directly into chart data to view sample detections, including the original image, detected objects, bounding boxes, and detection classifications. This transparency allows organizations to verify data quality and understand how the AI system generated counts.
Detection Audit Features
- •View the original image for any detection event
- •See detected objects with bounding boxes
- •Review detection classifications and confidence scores
- •Trace any dashboard metric back to source imagery

Integrated Maps
Spatial context is central to recreation monitoring. The platform includes integrated maps showing monitoring station locations, project coverage areas, and activity distribution across sites.
Maps allow users to explore recreation activity geographically and understand how different access points contribute to overall park usage. Station markers can be color-coded by activity levels, making it easy to identify high-traffic and low-traffic locations at a glance.
Data Export and Integration
All recreation telemetry data can be exported for further analysis. Organizations can use exported data for planning reports, grant applications, recreation studies, and infrastructure investment decisions.
Export Formats
- •CSV (comma-separated values)
- •Excel spreadsheets
- •GIS-compatible data formats
Common Use Cases for Data Export
- •Planning reports and master plans
- •Grant applications requiring usage data
- •Recreation demand studies and research
- •Infrastructure investment justification
Built for Recreation Infrastructure Monitoring
The Waypoint Cloud Platform transforms raw sensor imagery into structured recreation telemetry that organizations can trust and act on. By combining spatial monitoring, AI-powered detection, and transparent data auditing, the platform provides a modern foundation for understanding how people use outdoor infrastructure.
From park districts managing regional trail systems to conservation organizations measuring recreational impact, the platform delivers the insights needed to make informed decisions about outdoor infrastructure planning, operations, and stewardship.