Transportation & Mobility Analytics
Measure pedestrian and cyclist volumes, directionality, and crossing behavior on shared-use paths, bridges, and corridors — the observational data transportation planners need without staffing manual counts.
Questions We Answer
How many people walk and bike this corridor?
Is this pedestrian crossing safe and well-used?
What's the directional flow across this bridge?
How do volumes change by time of day and season?
How do commute and recreation peaks differ?
Can we support a grant or warrant analysis with this data?
What You Get
Mode breakdown
Separate pedestrians, cyclists, and other users automatically.
Directional flow
Crossing and corridor directionality for safety and planning analysis.
Time-of-day volumes
Continuous counts across days, weeks, and seasons.
Defensible methodology
Image-validated observations agencies and DOTs can stand behind.
Transportation & Safety Applications
Traffic & Safety Studies
Pedestrian and cyclist volumes, directionality, and behavior are the inputs safety and active-transportation studies depend on — collected continuously instead of from a single one-day manual count.
Measured continuously:
- Crossing and corridor demand
- Directional flow
- Peak periods by time and season
- User behavior and mode mix
Applications include:
- Crossing upgrades
- Signal warrant analysis
- Traffic calming projects
- School-access studies
- Grant applications
Why Image-Based Monitoring
Traditional traffic studies often require field crews and short collection windows. Image-based monitoring extends the record and adds context a tube or beam can't.
Waypoint enables:
- Longer, continuous collection periods
- Seasonal and multi-month analysis
- Remote monitoring without field staff
- Image validation of every observation
Metrics We Capture
Every metric below is derived from image-validated detections — exportable and auditable, not modeled estimates.
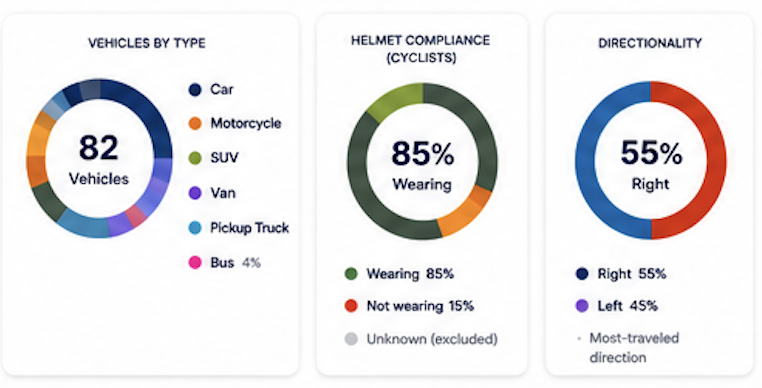
What the Data Looks Like
Vehicle classification, helmet compliance, and directional flow for a corridor.
Explore Transportation & Mobility
Pedestrian Crossings
Measure how many people use a crossing, when, and in which direction — observational data to assess safety, justify improvements, and support traffic studies.
Bike Corridors
Measure cyclist volumes, directionality, and commute-versus-recreation patterns along corridors — the data planners need to prioritize and evaluate bike infrastructure.
Shared-Use Paths
Understand the mode split, volume, and directional flow on shared-use paths — the evidence to manage conflict, plan capacity, and design complete streets.