Pedestrian Crossing Analytics
Measure how many people use a crossing, when, and in which direction — observational data to assess safety, justify improvements, and support traffic studies.
Questions We Answer
How many people use this crossing?
Is the crossing safe and well-used?
What times see the most pedestrians?
What is the directional flow?
What We Measure
Pedestrian counts
Continuous, image-validated crossing counts.
Crossing safety insight
Usage evidence to support safety assessments.
Time-of-day volumes
See peak crossing periods across days and weeks.
Directionality
Directional flow for crossing and corridor analysis.
Transportation & Safety Applications
Safety & Traffic Studies
Crossing demand, directionality, and pedestrian behavior are core inputs to safety analysis and signal warrants — and they are exactly the variables a single one-day manual count captures least reliably. Waypoint collects them continuously and with image validation, so the volume and behavior figures behind a crossing upgrade or a traffic-calming project rest on weeks of evidence rather than a few hours of fieldwork.
Measured at the crossing:
- Crossing demand and volume
- Directional flow
- Peak periods
- User behavior and grouping
Applications include:
- Crossing upgrades
- Signal warrant analysis
- Traffic calming
- School-access studies
- Grant applications
Long-Term Monitoring
A manual crossing count is expensive, short, and easily skewed by the day it happened to fall on. Image-based monitoring extends the record across multiple weeks and seasons with minimal field effort — and validates every observation, so reviewers can trust both the count and the conditions behind it.
- Multi-week collection
- Multi-season analysis
- Remote monitoring
- Image validation of each count
Metrics We Capture
Every metric below is derived from image-validated detections — exportable and auditable, not modeled estimates.
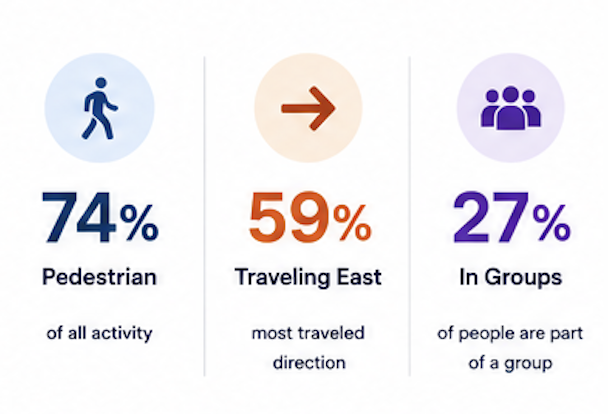
From Raw Image to Real-Time Insight
Directionality, grouping, and volume insights from a pedestrian-crossing deployment.