Pickleball Court Usage Analytics
Pickleball demand is outpacing supply almost everywhere. Measure how heavily courts are used and when they're at capacity to answer, with data, how many courts your community actually needs.
Questions We Answer
How many pickleball courts do we need?
How often are courts at capacity?
When is peak play?
Is demand outpacing supply?
What We Measure
Court occupancy
Measure real utilization across every court.
Peak windows
See when courts fill and how long peak demand lasts.
Demand vs. supply
Quantify whether courts are over- or under-built for demand.
Investment justification
Defensible data to support adding or converting courts.
Planning & Investment Applications
Understanding Real Court Demand
Pickleball has become one of the fastest-growing recreational activities in North America, and parks departments are fielding a steady stream of requests for additional courts, lighting, and dedicated facilities. Most of those decisions are still made on anecdote — a vocal user group, one crowded evening, a petition — rather than a clear picture of how the courts are actually used across the day, week, and season.
Occupancy data answers:
- Are courts operating at capacity?
- How often do players wait for an open court?
- What times see the greatest demand?
- How do facilities compare across the community?
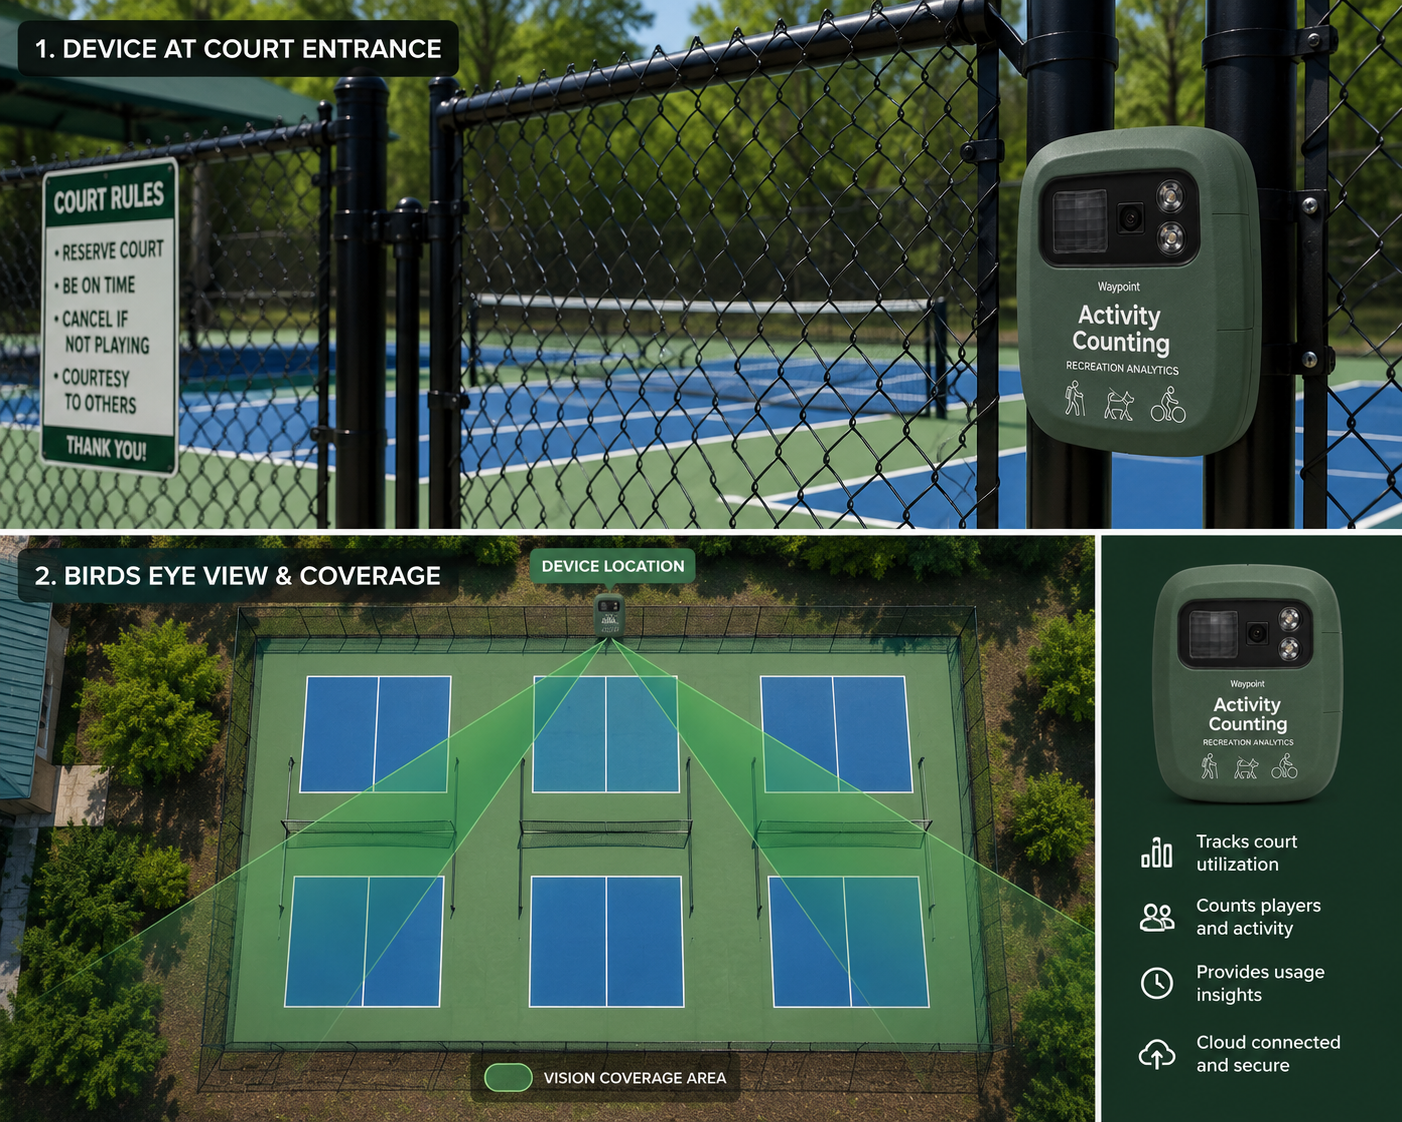
Waypoint provides continuous court occupancy monitoring so agencies can see when courts are in use, how frequently they reach capacity, and how demand shifts over time. Rather than reacting to the loudest request, decision-makers work from a defensible record of real utilization.
Supporting Capital Improvement Decisions
Deciding whether to add courts is often difficult and politically sensitive. A facility can look packed during peak evening hours yet sit largely unused the rest of the week, while another sustains genuine demand all season and clearly warrants expansion. The difference is invisible without sustained measurement.
Supports:
- Court expansion
- Tennis-to-pickleball conversions
- Capital improvement planning
- Site selection
- Grant and budget requests
By measuring occupancy over extended periods, Waypoint quantifies whether demand consistently exceeds capacity, surfaces seasonal trends, and lets you compare facilities side by side — evidence that strengthens capital improvement plans, grant applications, and long-range recreation strategy.
Measure the Impact of New Courts
When you add or convert courts, before/after data shows whether the investment actually relieved demand or simply revealed more of it — the kind of result that makes the next funding request far easier to defend.
Compare before vs. after:
- Occupancy and utilization rate
- Peak demand
- Seasonal growth
- Spillover to other facilities
Metrics We Capture
Every metric below is derived from image-validated detections — exportable and auditable, not modeled estimates.
From Raw Image to Real-Time Insight
Solar-powered field stations capture imagery that our AI turns into clean, classified detections in seconds.