Tennis Court Usage Analytics
Understand how heavily tennis courts are used and when — the data to balance court allocation, plan conversions, and justify maintenance or expansion.
Questions We Answer
How heavily used are our tennis courts?
When are courts full?
Should courts be converted or added?
How does demand shift seasonally?
What We Measure
Court occupancy
Measure utilization across courts and time.
Capacity windows
Identify when courts reach capacity.
Conversion & expansion data
Evidence to guide court allocation decisions.
Seasonal demand
Track how tennis demand changes across the year.
Planning & Investment Applications
Balancing Competing Recreational Demands
Across the country, communities are weighing how to accommodate surging pickleball demand while preserving access to existing tennis facilities. These discussions generate strong opinions from every user group, which is precisely why objective data is so valuable. Conversion, shared striping, and dedicated-facility decisions all hinge on a question that feeling can't answer: how heavily are the tennis courts actually used?
Questions we help answer:
- Which courts are underutilized?
- Which operate near capacity?
- How does demand vary by season?
- Is conversion to pickleball justified?
Supports:
- Tennis vs. pickleball allocation
- Court conversions
- Reservation policy
- Maintenance prioritization
By measuring utilization over time, Waypoint establishes a factual baseline — whether courts operate near capacity, how usage varies by season, and whether demand supports conversion, expansion, or preservation — so agencies can balance the needs of multiple user groups on evidence rather than volume.
Evaluating Facility Investments
Resurfacing, lighting upgrades, accessibility improvements, and amenity additions all represent meaningful investments in public infrastructure, yet agencies rarely have a way to confirm whether those improvements actually increased use. Comparing utilization before and after a project closes that gap.
Measure usage change after:
- Court resurfacing
- Lighting installation
- New amenities
- Facility expansion
The result is a clearer understanding of how each investment influenced activity — and a stronger, evidence-backed case for the next round of funding.
Metrics We Capture
Every metric below is derived from image-validated detections — exportable and auditable, not modeled estimates.
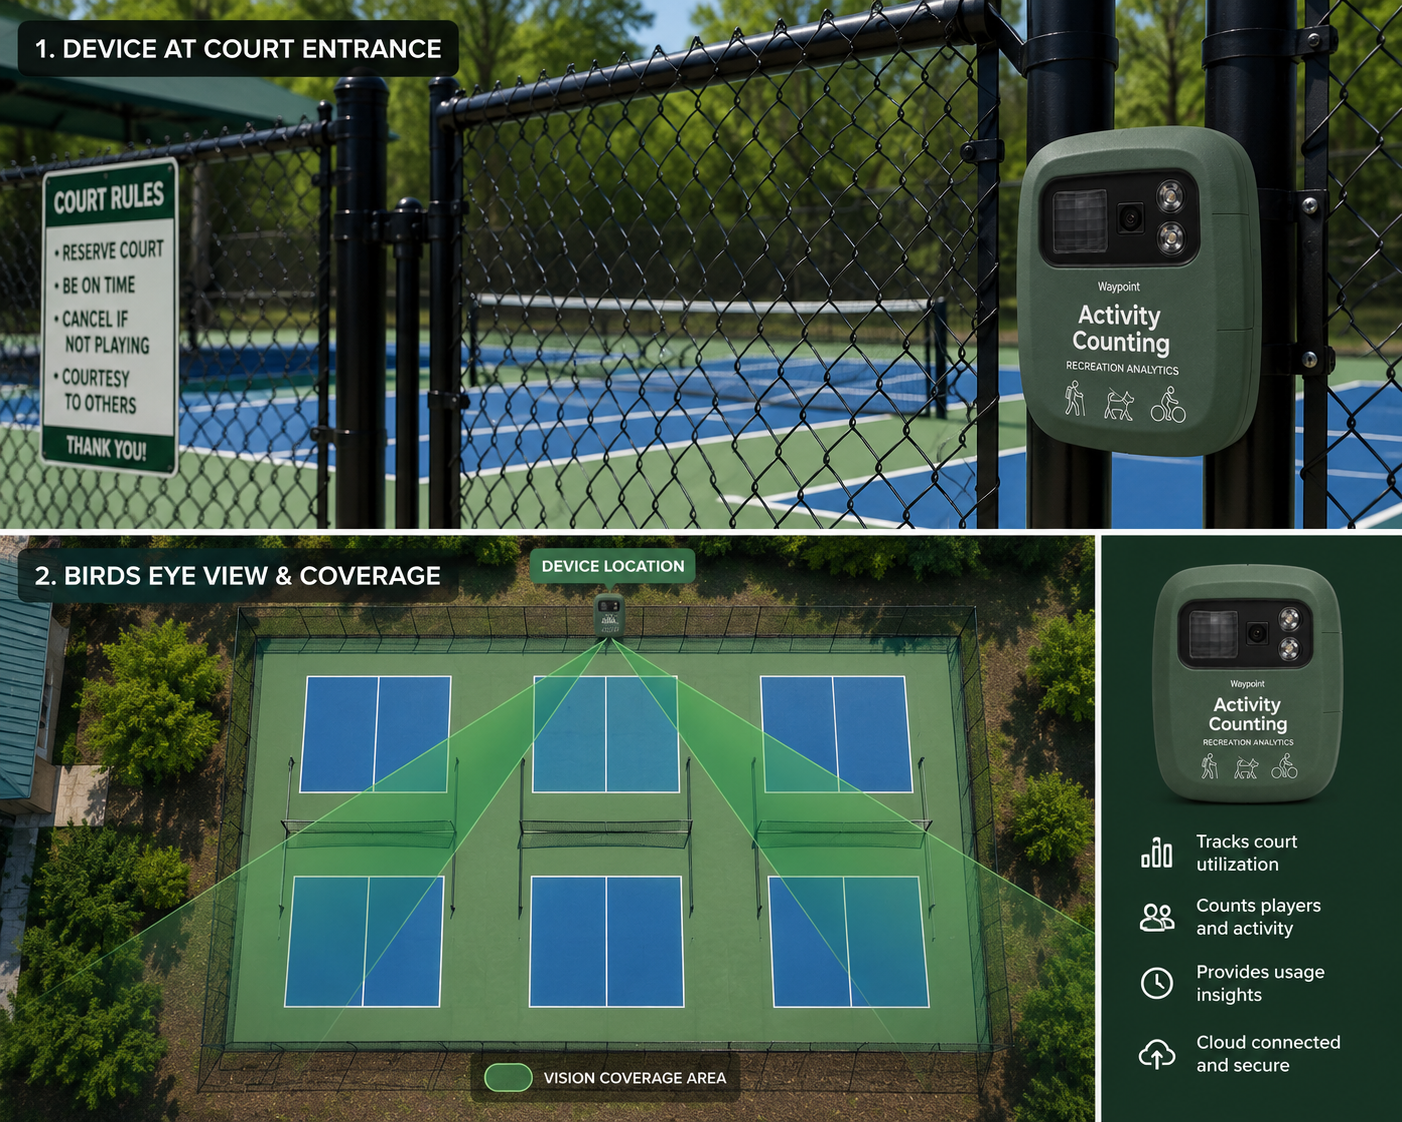
From Raw Image to Real-Time Insight
Solar-powered field stations capture imagery that our AI turns into clean, classified detections in seconds.