Skatepark Usage Analytics
Measure how heavily a skatepark is used and when, so usage data — not anecdotes — informs programming, maintenance, and expansion decisions.
Questions We Answer
How busy is the skatepark?
When are peak hours?
How does usage vary by season and weather?
Is the facility used enough to justify expansion?
What We Measure
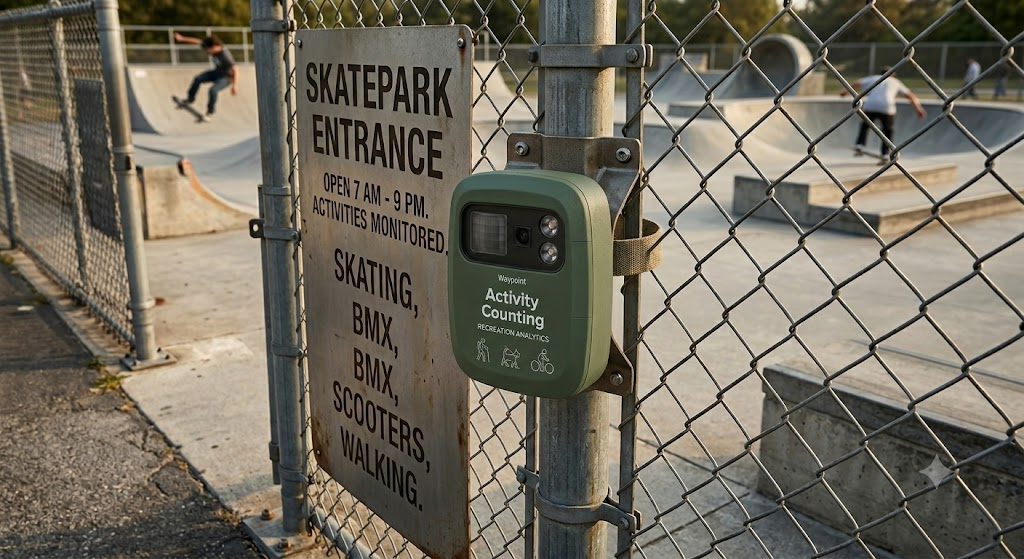
Occupancy tracking
Measure real utilization throughout the day.
Peak hours
Identify the windows of heaviest use.
Seasonal & weather patterns
See how conditions drive usage.
Investment justification
Defensible data for programming and expansion.
Planning & Investment Applications
Utilization Beyond Anecdotes
Skatepark decisions are among the hardest in a park system to ground in data. Use is famously difficult to count by hand, hours are informal, and the user community is often underrepresented in the surveys and meetings that drive funding. As a result, programming and capital choices tend to rest on observation and community feedback alone.
Waypoint provides:
- Daily visitation patterns
- Peak occupancy periods
- Seasonal demand
- Facility-to-facility comparisons
Continuous occupancy monitoring replaces that anecdote with a measured record — daily visitation patterns, seasonal demand, peak occupancy periods, and how one facility compares to another.
Programming & Events
Skateparks often anchor lessons, competitions, and community events, but their impact is rarely measured. Tracking occupancy around programming shows whether an event drew a crowd and whether that interest persisted afterward — useful evidence for the recreation staff who plan and fund it.
Measure the impact of:
- Competitions
- Lessons and clinics
- Community events
- Facility improvements
Weather & Seasonal Patterns
Skatepark use swings hard with weather and daylight. Understanding those swings helps managers set hours, justify lighting, and time seasonal programming for when riders are actually present.
- Weather-correlated usage
- Daylight and lighting impact
- Seasonal demand
Supports:
- Expansion
- Lighting and hours
- New features
- Maintenance scheduling
Metrics We Capture
Every metric below is derived from image-validated detections — exportable and auditable, not modeled estimates.
From Raw Image to Real-Time Insight
Solar-powered field stations capture imagery that our AI turns into clean, classified detections in seconds.