Hiking Trail Analytics
Count hikers accurately, see exactly when trails peak, and quantify how foot traffic changes over time — the data agencies need to prioritize maintenance and protect sensitive areas.
Questions We Answer
How many hikers use this trail?
When are the busiest days and hours?
Is foot traffic growing year over year?
Where is trail wear concentrating?
What We Measure
Accurate hiker counts
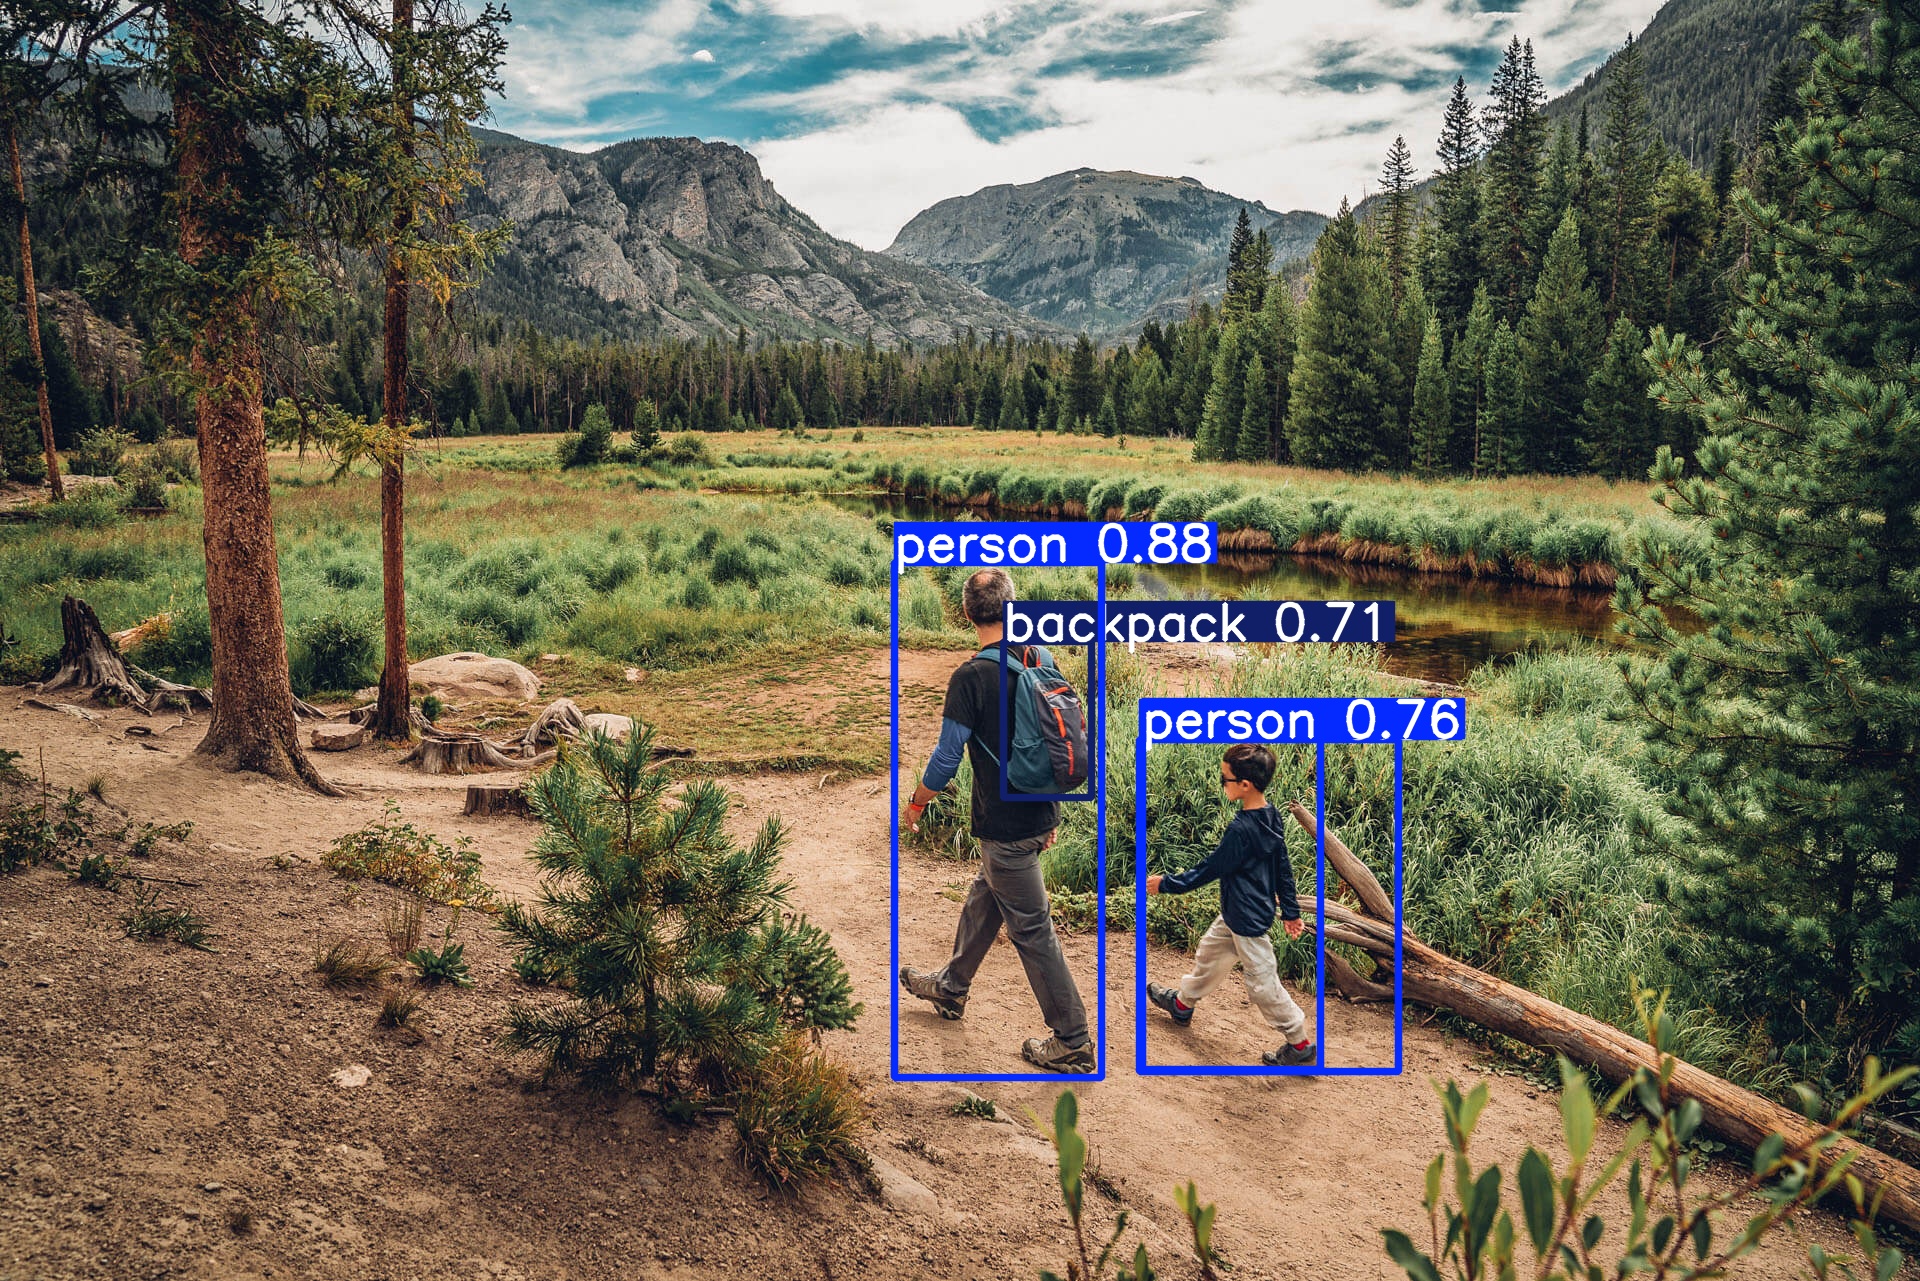
Image-validated counts of every hiker, not estimated infrared pulses.
Peak-period insight
Pinpoint the days and hours when trails are busiest.
Growth tracking
Quantify how usage trends across seasons and years.
Conservation & impact data
Direct maintenance and protection to the most-used segments.
Planning & Operations Applications
Trail Stewardship & Maintenance Planning
Foot traffic is the single largest driver of trail wear, and it rarely distributes evenly — a handful of segments, switchbacks, and pinch points absorb most of the impact. Knowing which segments carry the most hikers, and when, lets stewardship crews direct tread work, drainage, and revegetation to where the pressure actually is rather than spreading limited resources thin across the network.
Hiker data informs:
- Tread and surface maintenance priorities
- Protection of sensitive or revegetating areas
- Seasonal closures and rerouting
- Capacity and crowding management
Supports:
- Maintenance budgets
- Grant applications
- Long-range trail plans
The same record supports the harder calls: timing seasonal closures, rerouting around sensitive or revegetating habitat, and managing crowding before it degrades either the experience or the resource.
Trail Network Analysis
A trail rarely stands alone. Comparing counts across segments, entrances, and destinations reveals how visitors actually move through a network — which loops absorb the most demand, which connectors are underused, and where pressure concentrates as the system grows. That picture is the foundation for prioritizing investment across an entire trail system rather than one segment at a time.
Compare across the network:
- Trail segments and loops
- Entrances and access points
- Destinations and turnaround points
- Seasonal and year-over-year shifts
Why Counts Alone Aren't Enough
An infrared beam can tell you that something passed, but not much else. It can't tell a hiker from a cyclist, can't tell a family of four from a single person, and can't tell you which way anyone went — exactly the distinctions that change a planning decision. Image-validated detection captures all three, so the count behind a maintenance request or a grant application is classified, directional, and auditable.
- Classified hiker counts, not raw pulses
- Group size, so a family isn't counted as one
- Travel direction for loop vs. out-and-back
Metrics We Capture
Every metric below is derived from image-validated detections — exportable and auditable, not modeled estimates.
From Raw Image to Real-Time Insight
Solar-powered field stations capture imagery that our AI turns into clean, classified detections in seconds.