Parking & Lot Access Analytics
Measure how full trailhead lots get, when they fill, and how often they overflow — the data to size parking, manage congestion, and connect access demand to trail usage.
Questions We Answer
When does this lot fill up?
How often does it overflow?
How does parking demand track with trail usage?
Do we need more capacity?
What We Measure
Occupancy & fill times
See when lots reach capacity, by day and hour.
Overflow detection
Quantify how often demand exceeds available parking.
Vehicle counts
Count vehicles entering and using the lot.
Capacity planning data
Defensible evidence to size parking and access.
Planning & Operations Applications
Parking as a Window Into Recreation Demand
Parking occupancy is one of the clearest signals of recreation demand a facility produces. While visitor counts matter, the parking lot often reveals when a facility approaches capacity and where access itself becomes the constraint — the point at which would-be visitors circle, park illegally, or simply leave. Continuous occupancy monitoring captures that signal across the day, week, and season.
Track:
- Peak occupancy
- Overflow and spillover events
- Dwell duration and turnover
- Seasonal demand
Combined with on-site activity monitoring, parking analytics give a community a far more complete picture of demand across an entire facility or park system.
Identifying Capacity Constraints
Many agencies receive steady feedback that parking is insufficient, but confirming whether more parking is genuinely needed — versus a few peak hours on a handful of days — is difficult. Measuring occupancy patterns, peak utilization periods, and documented overflow events quantifies the problem, giving infrastructure and expansion decisions a stronger, more defensible foundation.
Supports:
- Capacity and expansion decisions
- Overflow management
- Access and signage
- Grant applications
Link Parking to Recreation Activity
Few systems can connect a parking lot to what people actually do after they park. Because Waypoint can watch both the lot and the destination, you can tie occupancy directly to recreation activity — a major differentiator over standalone parking sensors and trail counters.
Quantify relationships between:
- Parking occupancy and trail usage
- Parking and boat-launch demand
- Parking and overall park visitation
- Parking and event activity
Metrics We Capture
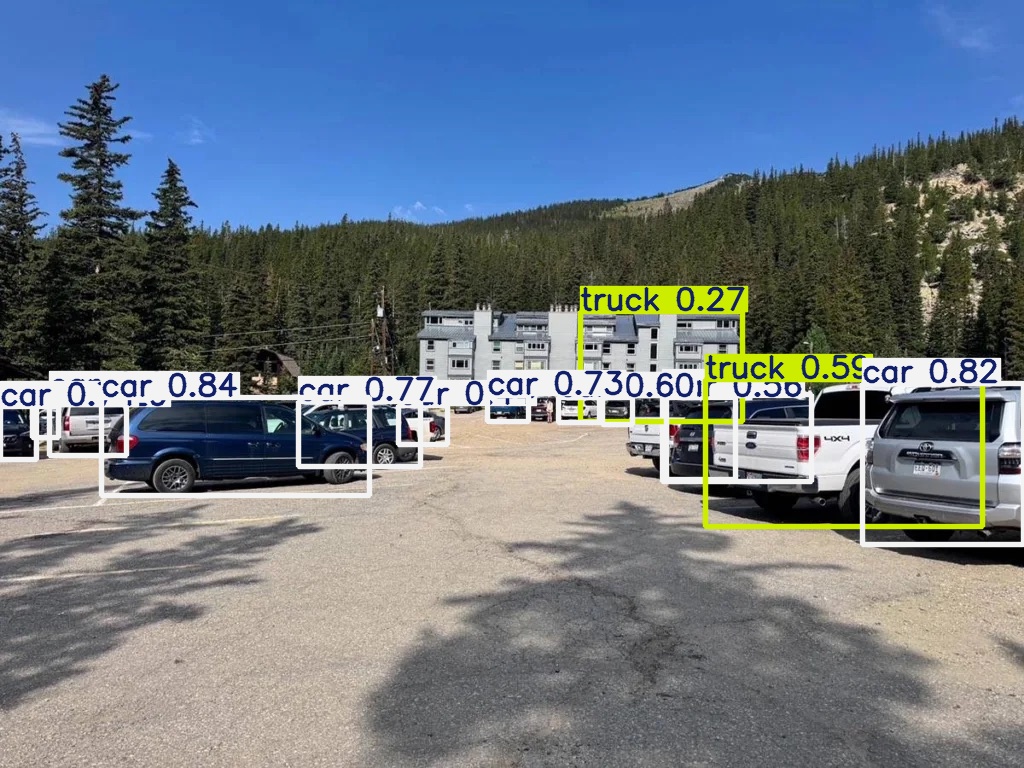
Every metric below is derived from image-validated detections — exportable and auditable, not modeled estimates.
From Raw Image to Real-Time Insight
Solar-powered field stations capture imagery that our AI turns into clean, classified detections in seconds.