Dog Park Usage Analytics
Understand how heavily dog parks are used and how sites compare — the data to prioritize maintenance, plan amenities, and justify new locations.
Questions We Answer
How busy is the dog park?
When are peak times?
How does usage compare across sites?
Should we expand or add locations?
What We Measure
Usage counts
Measure visitation at each dog-park site.
Peak periods
See the busiest times of day and week.
Cross-site comparison
Rank sites by demand to guide investment.
Maintenance prioritization
Direct dollars to the most-used facilities.
Planning & Investment Applications
Prioritizing Maintenance & New Locations
Dog parks generate strong opinions and almost no data. Demand for off-leash space is among the most common requests parks departments field, yet there's rarely an objective basis for deciding which sites need attention or whether a new park is warranted. Comparative usage data shows which locations are heavily used, how demand varies by season, and whether a community has genuinely outgrown its existing facilities.
Questions agencies ask:
- Do we need another dog park?
- Where should it be located?
- Which parks are over capacity?
- Which sites need maintenance most?
Amenity Planning
Off-leash areas live or die on their amenities — water stations, shade, parking, fencing, and waste stations all shape how heavily a site is used. Usage data tied to a specific site helps justify and size those amenities for real demand rather than assumption.
Understand demand for:
- Off-leash areas
- Water and shade
- Parking
- Waste and fencing infrastructure
Supports:
- Amenity additions
- New-location justification
- Maintenance prioritization
Site Comparisons & Operations
Knowing the busy windows lets crews schedule maintenance around low-use periods, while cross-site comparison reveals which locations carry the system and which underperform. Together they turn dog-park management into a demand-driven exercise.
- Highest-demand locations
- Seasonal usage patterns
- Peak congestion periods
- Facility performance differences
Metrics We Capture
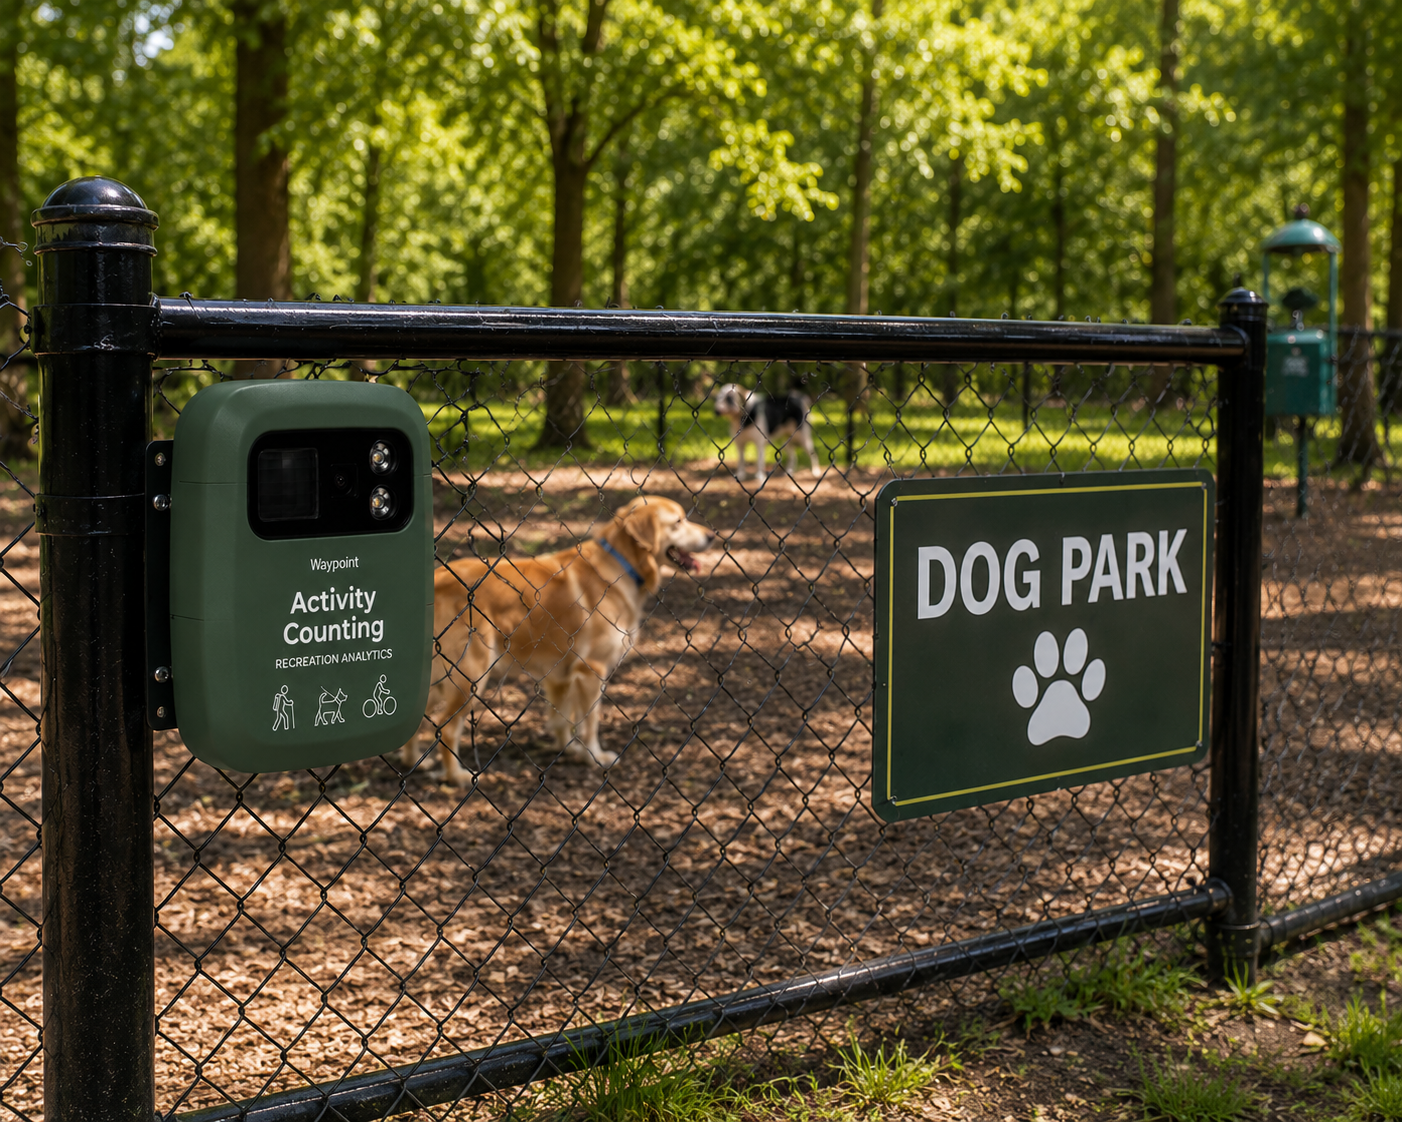
Every metric below is derived from image-validated detections — exportable and auditable, not modeled estimates.
From Raw Image to Real-Time Insight
Solar-powered field stations capture imagery that our AI turns into clean, classified detections in seconds.