
01 · The challenge
A shared facility, and two groups who both felt short of court time
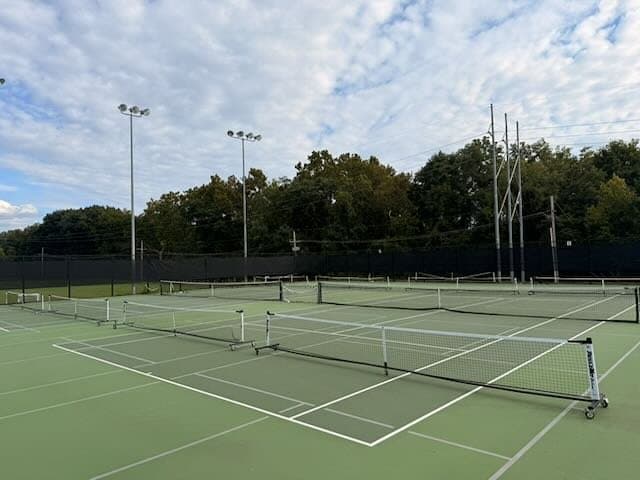
Leawood is a city of about 34,000 in Johnson County, on the south side of the Kansas City metro.[8] Most of its recreation happens at one place: Leawood City Park, 66 acres with soccer and baseball fields, an aquatic center, a dog park, greenway trailheads and six lighted tennis courts.[1]
As pickleball took off, those six courts became contested. Tennis players wanted their courts. Pickleball players wanted more room. The community debated mixed use against dedicated pickleball courts, and two of the tennis courts are now dedicated to pickleball. Every next step, from scheduling to new construction, depended on a question nobody could answer with confidence: how much is each court really used?
02 · Background
Four years of pickleball on the council agenda
June 2022
After noise complaints about a backyard tennis court used for pickleball, the City Council voted unanimously to have staff review the city’s sports-court rules.[4] New rules for private courts, including neighbor notice and evergreen screening, were approved in October 2023.[5]
April 2023
The city proposed 8 to 10 new pickleball courts at City Park for roughly $885,000, mostly from federal pandemic relief funds. The council took no final action.[3]
November 2025
With City Park’s courts striped for both sports and players sometimes at odds over who plays when, staff proposed eight pickleball-only courts on a soccer field east of the complex, which could free time on the existing courts for tennis. $1 million was already set aside in the long-range financial plan. The idea went to the Park & Recreation Advisory Board.[2]
Fall 2026
Leawood brought in Waypoint to measure utilization of every court continuously, by sport and hour, over several weeks of the fall season.
Leawood is not alone. Pickleball is the fastest-growing sport in the United States, with 24.3 million players in 2025, up from about 4.2 million in 2020.[6] Next door in Prairie Village, tennis courts restriped for pickleball drew noise complaints, and the city took down nets on four of six courts as a trial.[7]
03 · Why anecdotes weren’t enough
When every side has a story, a count settles the facts
Court decisions are usually made from complaints, sign-in sheets and staff impressions. Each group remembers the hour it waited for a court. Nobody sees the empty mornings. In late 2025 the city cited a camera sampling of three courts that suggested about 11 hours of pickleball a day.[2] Before committing a million dollars to new courts, it needed the full picture: every court, both sports, every hour, for weeks.
The study had to answer concrete questions. When does each sport peak? Which courts sit idle, and when? How do weekdays differ from weekends? Is there room to rebalance the courts that exist, or is new construction the only answer?
04 · The approach
Every court a zone, every ten minutes
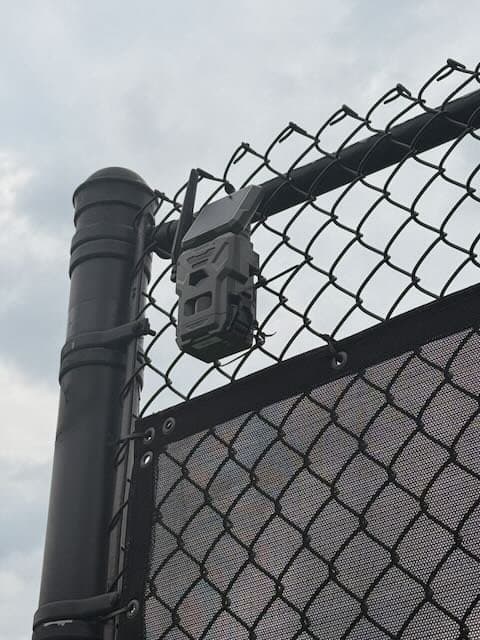
Four solar-powered cellular cameras were strapped to fence posts around the complex. No trenching, no power, no network. Each tennis court was drawn as its own zone, and the two courts dedicated to pickleball as one Pickleball Area. The cameras recorded the complex every ten minutes, and results count open hours only, 7 a.m. to 10 p.m.
A court counts as in use for a ten-minute sample when at least one person is standing on it. Utilization is the share of samples in use, so a court in play from 5 to 7 p.m. every evening reads very differently from one with a single long Saturday. Slots without a photo are left out rather than counted as empty.
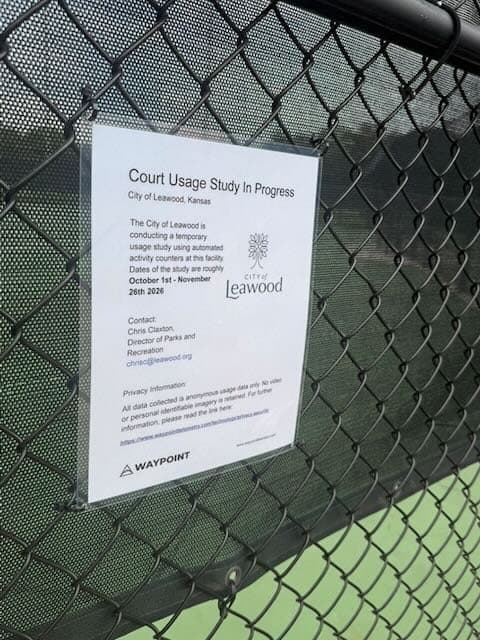
Players are counted, never identified. Notices on each gate told players what was being measured, who to contact at the city and how the data is handled. Read more in our court utilization validation and privacy and security.
05 · Results
The pickleball courts work hardest. One tennis court barely works at all.
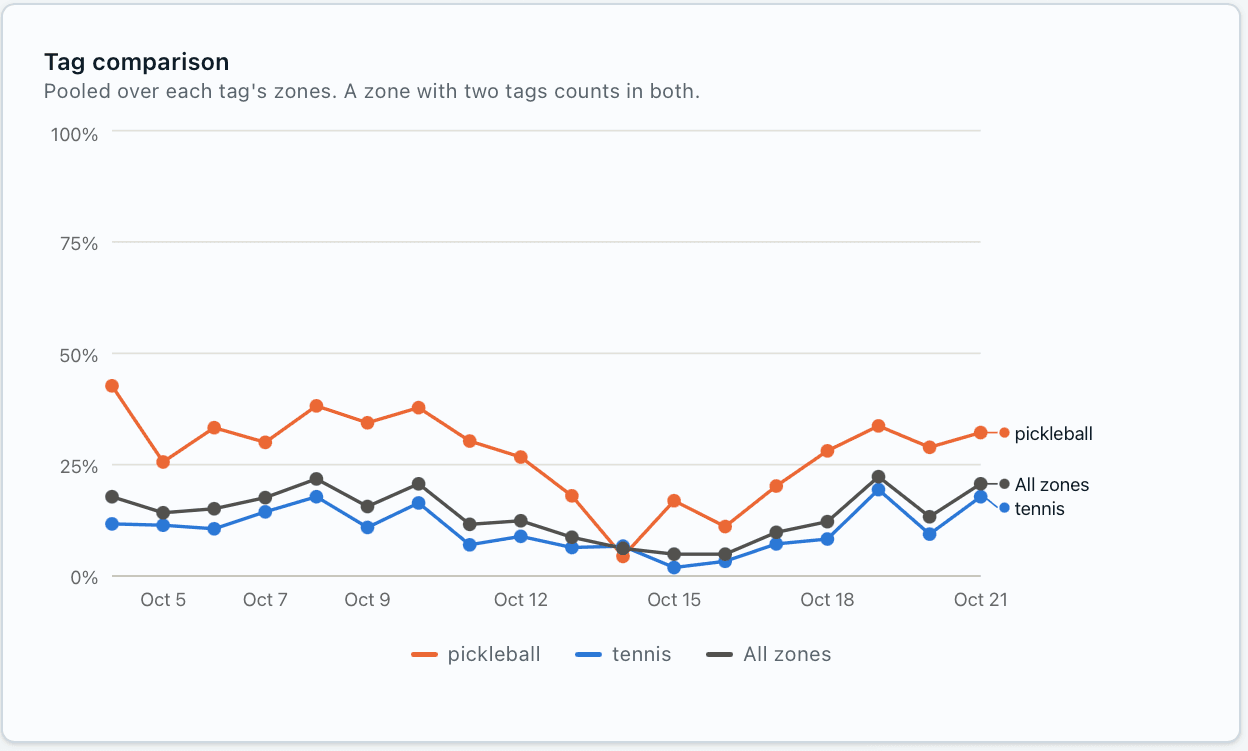
Over the first 30 days (Oct 4 to Nov 2), the Pickleball Area was in use in 27% of open-hour samples. The four tennis courts ranged from 15% down to 3%, about 10% on average. On every day but one in the first three weeks, the pickleball courts were busier than the tennis courts as a group.
The hour-by-hour picture is sharper still. Pickleball has a morning rush: from 9 to 10 a.m. the courts were in play 73% of the time, then again 54% to 55% of the time from 6 to 8 p.m. Tennis is an evening sport here, peaking between 6 and 8 p.m. at 27% to 33% on its busiest courts. The North West tennis court was in use only 3% of the time, and never more than 13% in any hour.
27%
Pickleball Area
15%
North East Tennis Court
13%
South West Tennis Court
9%
North Center Tennis Court
3%
North West Tennis Court
| Court | All | 7a | 8a | 9a | 10a | 11a | 12p | 1p | 2p | 3p | 4p | 5p | 6p | 7p | 8p | 9p |
|---|---|---|---|---|---|---|---|---|---|---|---|---|---|---|---|---|
| Pickleball Area | 27 | 4 | 17 | 73 | 38 | 7 | 3 | 11 | 21 | 16 | 23 | 31 | 55 | 54 | 44 | 18 |
| North East Tennis | 15 | 0 | 1 | 10 | 20 | 20 | 12 | 22 | 11 | 16 | 17 | 23 | 30 | 24 | 17 | 7 |
| South West Tennis | 13 | 3 | 7 | 26 | 10 | 6 | 3 | 5 | 9 | 9 | 6 | 17 | 33 | 28 | 15 | 10 |
| North Center Tennis | 9 | 0 | 2 | 3 | 6 | 8 | 6 | 5 | 6 | 3 | 11 | 14 | 20 | 27 | 17 | 8 |
| North West Tennis | 3 | 0 | 0 | 2 | 2 | 2 | 5 | 2 | 2 | 5 | 3 | 3 | 7 | 13 | 3 | 0 |
Reading these numbers honestly
The Pickleball Area covers two courts and counts as in use when anyone is playing on either, so it is not a strict court-for-court comparison with a single tennis court. Even so, the two busiest tennis courts together could at most match it. These are the first 30 days of a fall study that runs to late November, in the shoulder of both sports’ seasons.
06 · What it means for Leawood
Better conversations with residents and the council
Shared facts
Tennis and pickleball players see the same numbers for the same courts, hour by hour.
Past decisions checked
The courts dedicated to pickleball are the busiest in the complex: 27% of open hours.
Future spending grounded
Demand by sport and hour shows whether to rebalance existing courts, schedule them differently or build.
Park managers used the study to have better-informed conversations with the community and its representatives. The demand for pickleball that players described is real and measurable, and the courts already dedicated to it are the busiest in the complex. The same data shows tennis courts with room to spare outside the evening peak, which matters for scheduling, lessons and maintenance, and for the decision on new pickleball-only courts.
07 · Lessons learned
What we learned
- 01
Post the notice on the gate.
A sign from the city on every entrance, naming a staff contact and the privacy terms, answers questions before they become complaints.
- 02
Measure every court, not a sample.
Demand moves between courts during the day. Counting all of them shows overflow and idle time that a single court never reveals.
- 03
Report shares of time, not head counts.
For courts, the question is how often they are in play. A share of ten-minute samples answers it directly and compares fairly across courts.
08 · Sources
Sources
- City of Leawood, City Park
- Johnson County Post, Leawood pickleball courts at City Park (Nov. 13, 2025)
- Johnson County Post, Leawood funding for pickleball courts (Apr. 6, 2023)
- Johnson County Post, Leawood pickleball ordinance review (June 7, 2022)
- Johnson County Post, Leawood regulations for backyard sports courts (Oct. 30, 2023)
- Sports & Fitness Industry Association, U.S. pickleball participation
- Kansas City Star via Yahoo News, Prairie Village pickleball noise and court changes (Feb. 27, 2024)
- Kansas Data Center, Leawood 2020 Census profile
Utilization figures come from the Waypoint Analytics platform for the City of Leawood court study, Oct 4 – Nov 2, 2026, open hours 7 a.m. – 10 p.m.