
Pickleball & Tennis Court Analytics
How much are your courts actually being used? Measure pickleball and tennis court occupancy by hour, compare weekday and weekend demand, and track seasonal trends across facilities — the evidence behind decisions to add courts, convert courts, or shift recreation investment.
Questions We Answer
How much are our courts actually being used?
When do courts reach capacity?
How do weekday and weekend demand compare?
Do we need more pickleball courts — or better scheduling?
How does utilization compare across facilities?
Did a conversion or resurfacing change usage?
What You Get
Court occupancy
How many courts are in use, measured continuously instead of from spot checks.
Utilization by hour
See when courts fill and how long peak demand lasts.
Weekday, weekend & seasonal trends
Track how demand shifts across the week and the year.
Facility comparison
Compare utilization across court banks and parks.
Planning & Investment Applications
Court Capacity & Demand
Every parks board eventually asks whether the community has enough courts. Continuous occupancy data replaces sign-up sheets, complaints, and one-day observation counts with a measured answer.
Occupancy data answers:
- How often are courts at capacity, and for how long?
- Which hours and days see the greatest demand?
- Is demand coming from drop-in play the reservation system misses?
- Are additional courts justified?
Conversions, Lining & Shared Courts
Converting tennis courts, adding pickleball lines, or splitting schedules are easier to decide — and to evaluate — when utilization is measured before and after the change.
Track across a change:
- Utilization rate
- Peak demand
- Weekday vs. weekend use
- Seasonal growth
Comparing Facilities Across a System
Utilization across sites shows which court banks are over capacity and which are under-used, so maintenance dollars and new construction go where demand is.
- Rank facilities by utilization
- Spot under-used courts for reprogramming
- Support capital requests with measured demand
Metrics We Capture
Every metric below is derived from image-validated detections — exportable and auditable, not modeled estimates.
How Court Usage Is Usually Measured
| Method | Trade-off |
|---|---|
| Reservation and sign-up data | Misses drop-in play and no-shows. |
| Staff observation counts | A few snapshots, not the hours and seasons in between. |
| Resident surveys | Measures perceived demand, not actual use. |
| Waypoint | Continuous court occupancy by hour, across every season and site. |
What the Data Looks Like
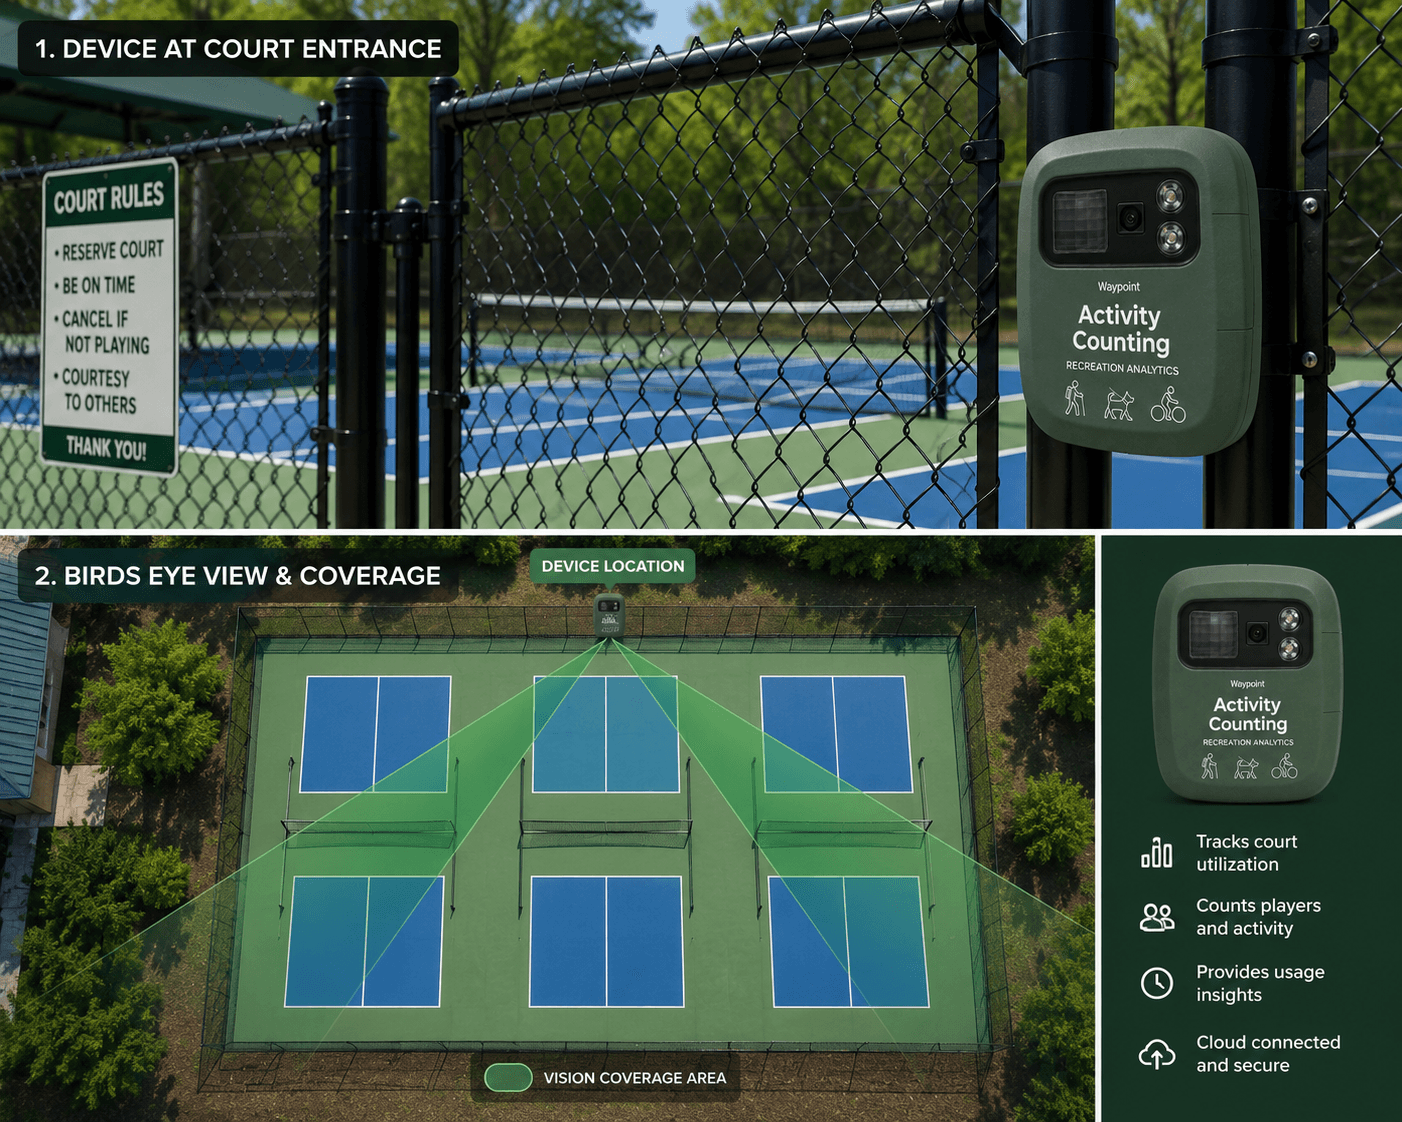
One sensor at the court entrance can cover a full bank of courts.
Explore Pickleball & Tennis Court Analytics
Pickleball Courts
Pickleball demand is outpacing supply almost everywhere. Measure how heavily courts are used and when they're at capacity to answer, with data, how many courts your community actually needs.
Tennis Courts
Understand how heavily tennis courts are used and when — the data to balance court allocation, plan conversions, and justify maintenance or expansion.
Explore Related
Court Utilization Validation
Field validation of two-court coverage from a single sensor.
Park & Facility Utilization
Pavilions, playgrounds, fields, and skateparks.
Parking Utilization
Vehicle volumes and peak parking demand at recreation facilities.
VisionAI One
The sensor behind every Waypoint solution.