
01 · The challenge
Proving a safety project worked, not just that it was built
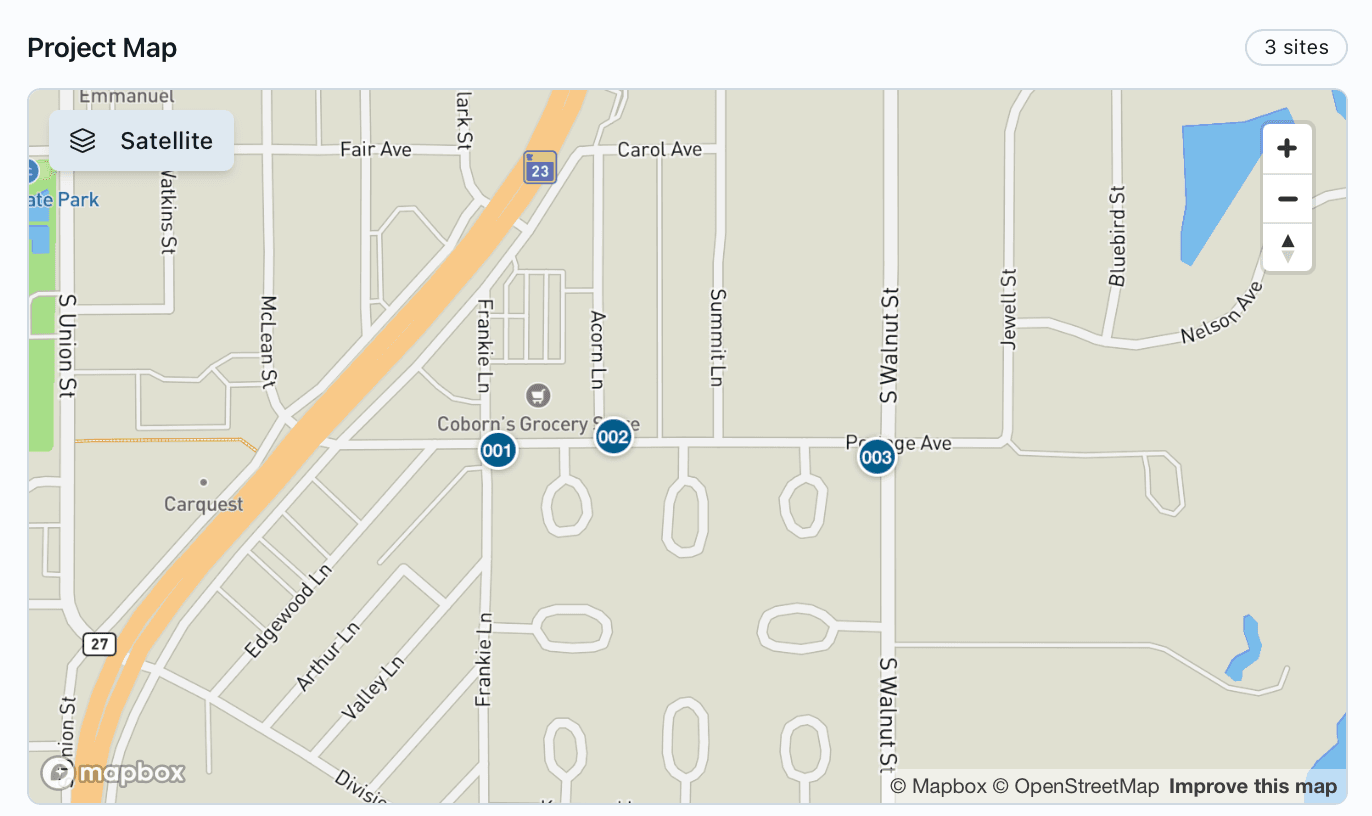
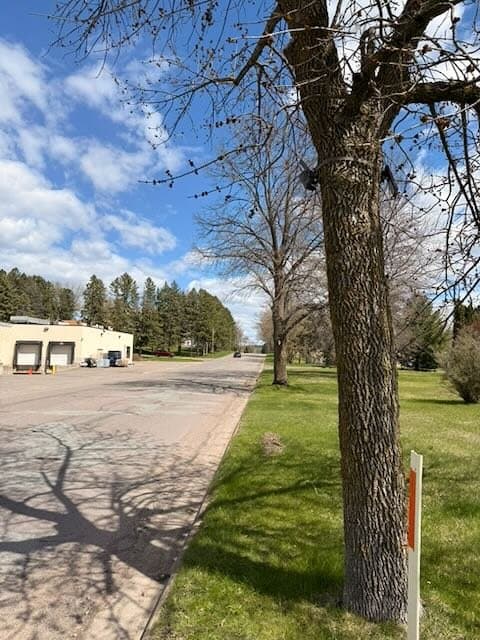
Mora is a city of 3,665 people and the county seat of Kanabec County, about 72 miles north of the Twin Cities at the junction of Highways 23 and 65.[8] Portage Avenue runs east from the highway past Coborn’s grocery store and into residential streets. It has no sidewalk. People walking to the store, walking dogs or riding bikes share the road and its shoulder with cars, pickups and buses.
The city wanted to change that, and to show residents, partners and funders that the change mattered. A ribbon-cutting shows that a path exists. It does not show whether more people walk, or whether they walk where it is safer. For that, Mora needed a count of pedestrians on the street before the project and the same count after it.
02 · Background
From a community plan to a test on the street
In January 2025, MnDOT selected Mora as one of ten Minnesota communities for Active Transportation Planning Assistance, to build a community-wide active transportation plan.[1] The program does not hand cities cash. MnDOT hires a consultant and grants the city its services, an estimated $100,000 of technical assistance per community, while the city covers any construction.[5]
The plan was led by a coalition of the Mora Bike Club, Mora Ski Club, Mora Public Schools, the City of Mora, Kanabec County, MnDOT District 3, the East Central Regional Development Commission and residents. Its draft goals were to connect key destinations, to use MnDOT’s upcoming reconstruction of Highways 23 and 65 to add walking and biking improvements, and to center residents with disabilities, routes to school and the aging population.[2] Walking and biking audits and community conversations ran in August 2025.[2]
The City Council adopted the plan unanimously, making it an official city planning document that strengthens Mora’s case for state and federal transportation grants.[4] Community Development Director Kirsten Faurie later told MnDOT that what pleased her most was that the suggested actions were “right-sized for our community.”[5]
One of those actions was a demonstration project: a temporary, low-cost change to the street that tests a design before the city invests in a permanent one. On Portage Avenue it added an 8-foot shared walking and biking path on the south side between Frankie Lane and Walnut Street (County Road 17), separated from traffic by flexible delineator posts, plus painted curb extensions and marked crosswalks at Frankie Lane and at Walnut Street.[3]
The timing matters. MnDOT plans to reconstruct Highway 65 through Mora in 2030 or later, and the design realigns Portage Avenue’s connection to the highway.[6] The earlier corridor study estimated about $25 million of work and recommended paved trails on both sides of the highway.[7] Evidence from Portage Avenue now can inform what gets built permanently then.
03 · Why ordinary counters fall short
A count across a roadway, with cars in every frame
Most pedestrian counters are infrared beams or sensors built for trails. They see a 4 to 8 foot path and register anything warm that crosses it: a person, a dog, a deer or a car. On Portage Avenue, people walk on the shoulder and the new path a few feet from moving traffic. An infrared counter would have counted the trucks.
Waypoint’s cameras look across the whole street and classify what they see. Each passage is labeled as a pedestrian, cyclist or vehicle, by direction of travel, with an image behind every count that the city can open and check. Identities are not recorded and faces are never analyzed. Read more about multimodal activity classification and vision versus infrared counters.
04 · The approach
Same places, same method, two windows
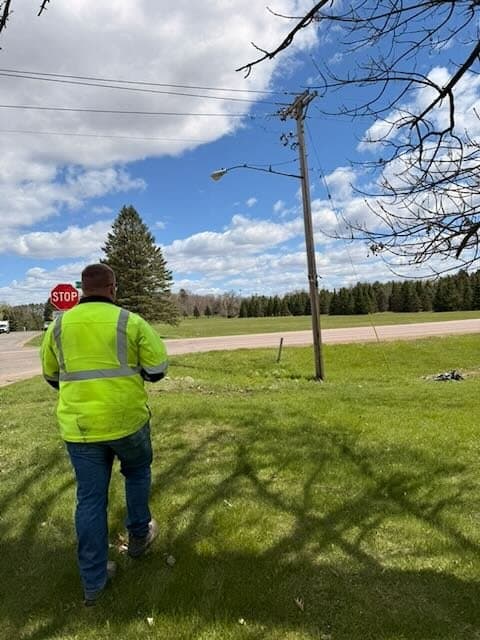
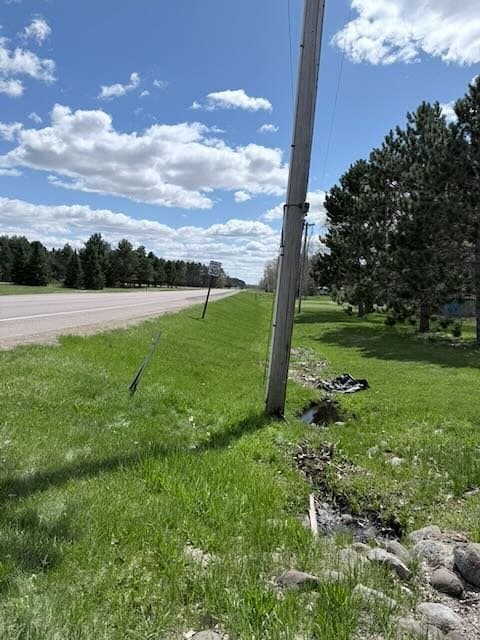
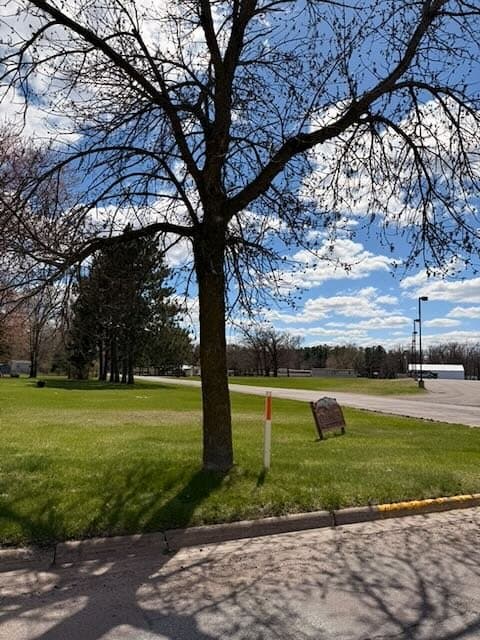
Three solar-powered cellular cameras were mounted at Frankie Lane, Acorn Lane and Walnut Street, the two ends and the middle of the planned path. They counted in May 2026, before the demonstration project, and again from mid-October 2026, with the path in place. No trenching and no site visits to download data.
Because the two windows had different lengths, the comparison uses a rate: pedestrian passages per place per hour, averaged over observed days. That keeps a longer study from looking busier only because it ran longer.
05 · What the baseline showed
May: one person for every 45 vehicles
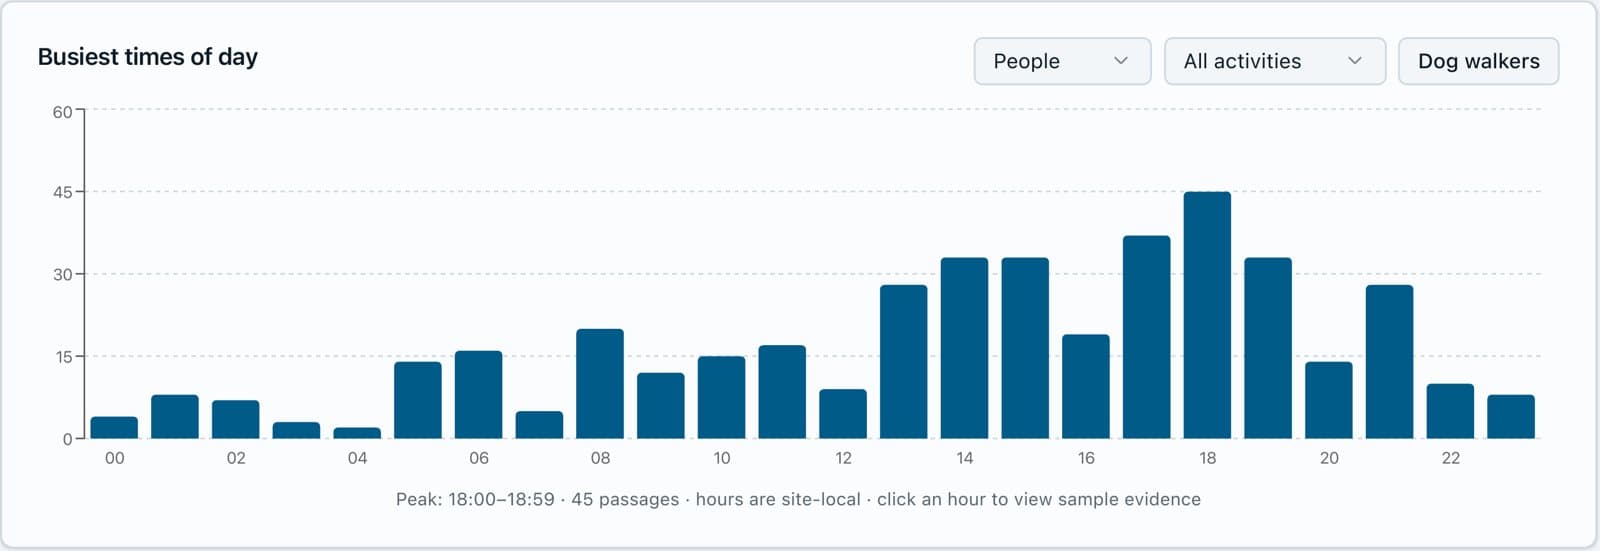
Over the May baseline the cameras recorded 19,149 vehicles and 420 passages by people: 80% on foot and 20% on bikes. 29% of people walked in groups, and the busiest hour was 6 to 7 p.m. The street was clearly used on foot, with no place set aside for it.

06 · Results
October: more people on foot at every place
With the path in place, pedestrian activity rose at all three places, from 0.48 to 0.77 passages per place per hour overall. The biggest change was at Frankie Lane, the west end of the path beside Coborn’s and one of the two intersections that got a painted curb extension and crosswalk, where the rate nearly tripled.
Frankie Ln
+173%
Acorn Ln
+32%
Walnut St
+25%
| Place | May | October | Change | Observed days |
|---|---|---|---|---|
| Frankie Ln | 0.27 | 0.75 | +173% | 9 · 9 |
| Acorn Ln | 0.66 | 0.87 | +32% | 8 · 6 |
| Walnut St | 0.54 | 0.68 | +25% | 8 · 4 |
| All places | 0.48 | 0.77 | +60% | 25 · 19 |
Reading these numbers honestly
This is an observational before-and-after study, not a controlled experiment. May and October differ in weather and daylight, and Acorn Lane and Walnut Street have fewer than seven October days, so not every weekday is represented. The increase held when the data was split by weather and by day of week, which is why we read it as a real change rather than a quirk of one window. Waypoint’s validation studies describe the counting accuracy behind these figures.
07 · What it means for Mora
Evidence for the permanent design
Defensible
A measured change at each place, with images behind every count, to share with residents, the council and MnDOT.
Targeted
The largest gain at Frankie Lane points to where crossings and connections matter most.
Repeatable
The same three places can be counted again as the design becomes permanent and when Highway 65 is rebuilt.
Mora is reviewing the counts with its project consultants as the demonstration project wraps up. A demonstration project exists to answer one question: is this worth building for good? On Portage Avenue, the counts say people used the space once it was there.
08 · Lessons learned
What we learned
- 01
Tell the neighbors first.
Cameras on a residential street raise questions. Notices before installation, saying what is counted and that no one is identified, prevent concern rather than answering it afterward.
- 02
Size power for the traffic.
A busy road means many captures. The October study used larger solar panels, and power for high-traffic sites is a design requirement of our own VisionAI One camera.
- 03
Compare rates, not totals.
Field windows rarely match. Normalizing to passages per place per hour, and flagging places with fewer than seven days, keeps a before-and-after comparison fair.
Engineering detail from the May baseline is in the Portage Avenue deployment notes.
09 · Sources
Sources
- MnDOT, “Ten Minnesota cities to receive Active Transportation Planning Assistance” (Jan. 23, 2025)
- MnDOT Let’s Talk Transportation, Mora Active Transportation Master Plan
- City of Mora survey, Portage Avenue Demonstration Project
- Kanabec County Times, “Mora City Council adopts transportation plan, approves fire truck purchase”
- MnDOT, “Active Transportation Planning Assistance now available” (Oct. 7, 2026)
- MnDOT District 3, Hwy 65 reconstruction in Mora
- MnDOT, Hwy 65 and Hwy 23 Mora Corridor Study
- Mora, Minnesota (2020 census population, geography)
Counts and charts come from the Waypoint Analytics platform for the City of Mora Portage Avenue studies (May and October 2026).