
01 · The challenge
A growing trail system, planned without a reliable count
Lowes Creek County Park covers 250 acres just south of Eau Claire. People come to mountain bike, walk dogs, hike, run, snowshoe and ski, and the park has a reservable picnic shelter and a trout stream.[1] It has about 5 miles of double-track ski trail and more than 6 miles of narrow, technical single track.[2]
The Chippewa Off Road Bike Association (CORBA), a volunteer nonprofit, builds and maintains much of that single track, and is adding facilities for skills and downhill riding. Plans like that need evidence: how many people use the park, which entrances they use, and how many of them are on bikes. CORBA had counted before, but the methods it tried gave inconsistent totals and could not tell a walker from a rider.
02 · Background
From a county master plan to a bike skills park
2022 – 2023
Eau Claire County’s parks master plan described Lowes Creek as popular for its trails, especially for running and mountain biking, and proposed making it “a regional destination for all trail related activities,” with a bike skills track. In its interview for the plan, CORBA called it the county’s most popular mountain biking destination.[3]
Spring 2023
CORBA, Eau Claire Youth Cycling and the 906 Adventure Team proposed a bike park with county approval, launched a fundraiser and held a public input session in Eau Claire.[5][4]
October 2023
The plan moved ahead: a beginner area of about one acre and a skilled area of about 4.5 acres, estimated at about $355,000.[6]
July 2024
The beginner Adventure Playground opened, funded almost entirely by one anonymous donor and built with volunteers and the county.[7] A larger, harder second phase is still being raised for.[8]
August – October 2026
CORBA and Waypoint ran a 65-day pilot at four trail access points to measure who uses the park, where and when.
03 · Why counts fell short
A total count hides the questions that matter
A trail counter that only adds up passes can’t answer what CORBA and the county needed to know. How much of the traffic is bikes, and how much is people on foot? Which entrance carries the load? And what part of a season’s total is ordinary use, rather than a single event?
That last question is a real one at Lowes Creek. The park closes its trails for races: a cross-country running invitational on a Saturday morning in late August 2025, and a Wisconsin interscholastic mountain bike race the following weekend.[9][10] One race morning can put more people past a counter than a normal month does. Counted as everyday use, it distorts every average built on top of it.
04 · The approach
Four access points, no wiring, a dashboard from day one
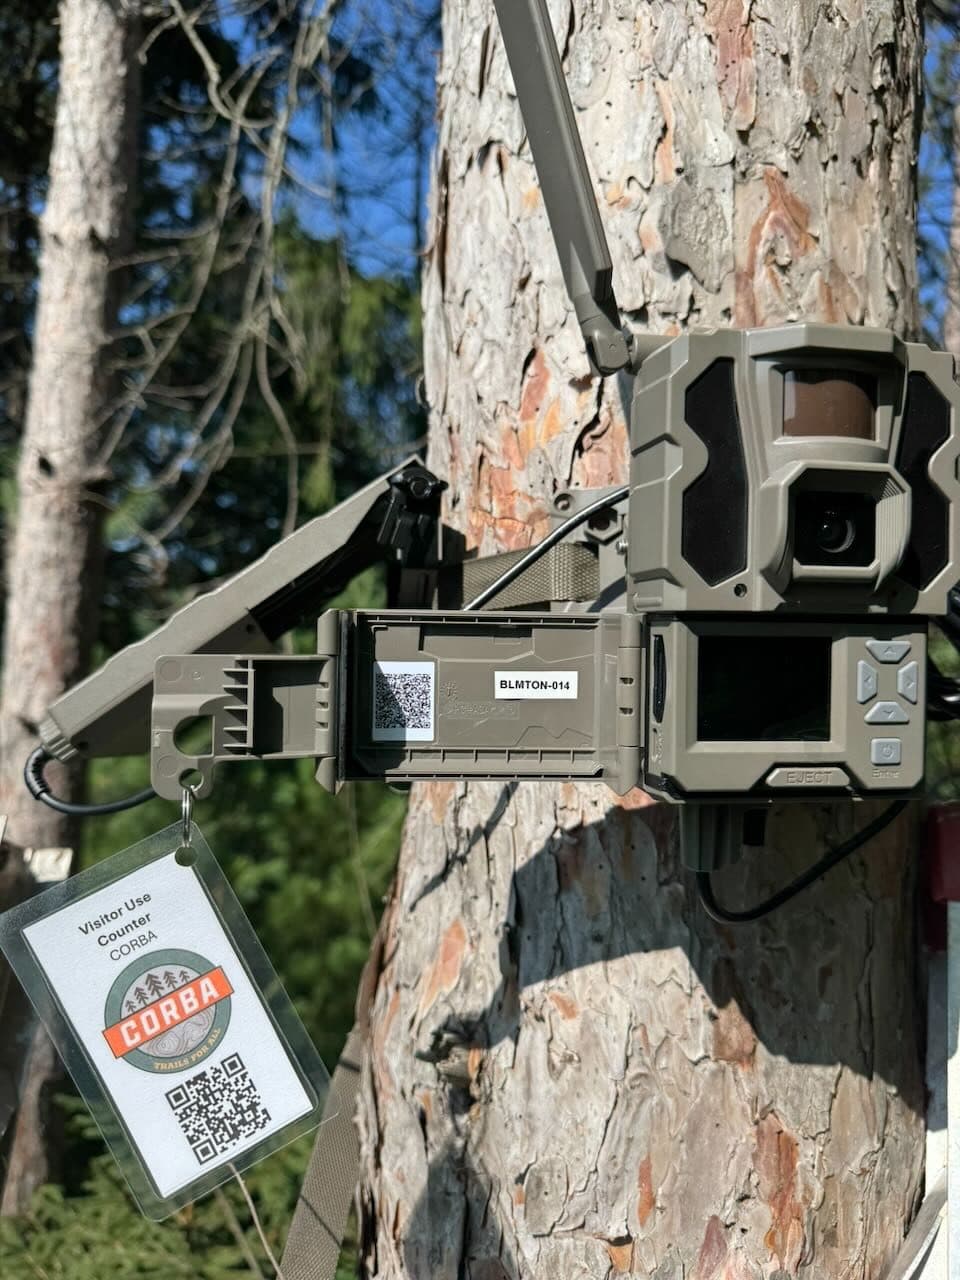
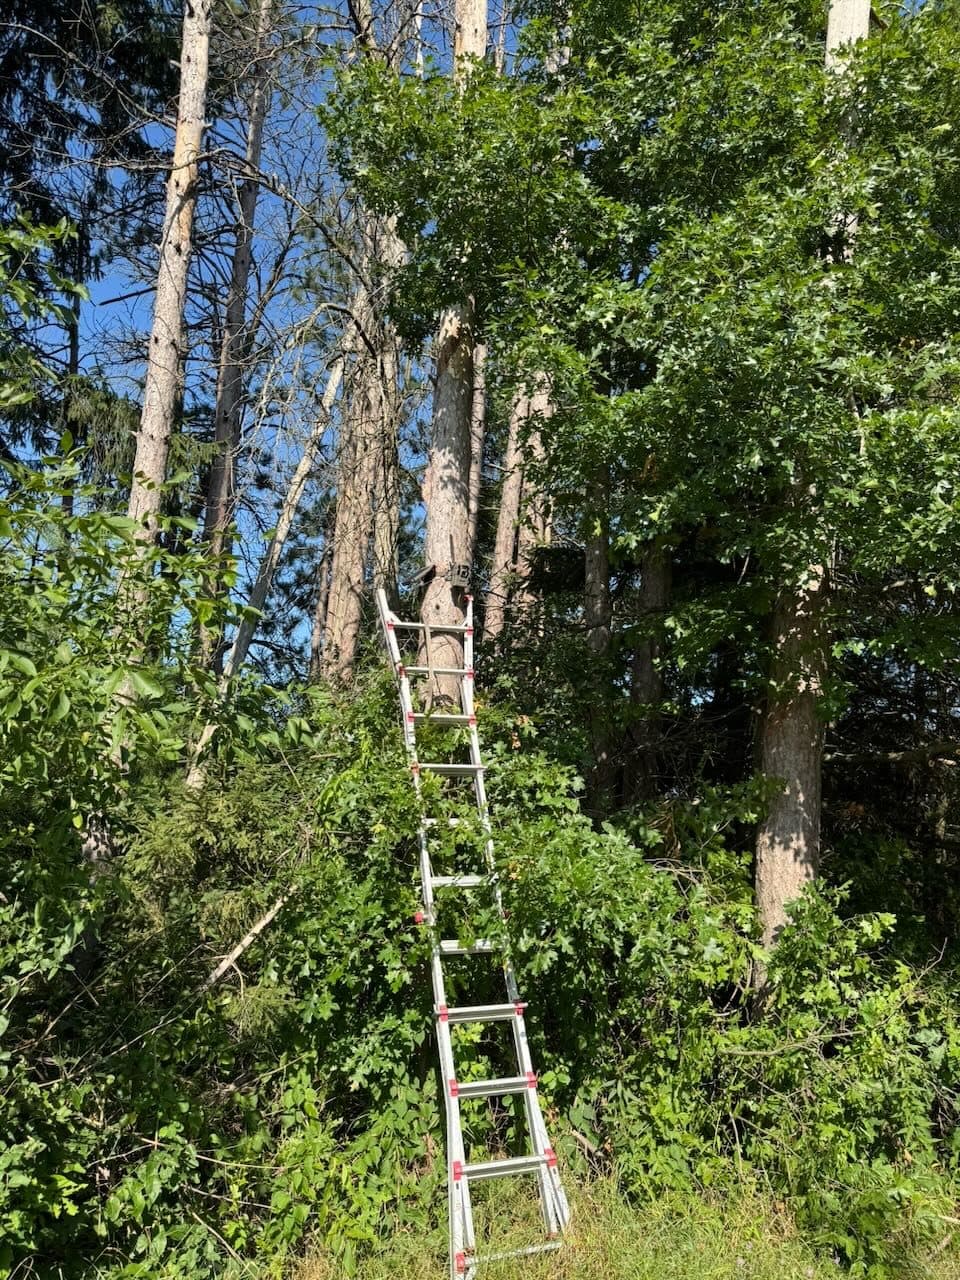
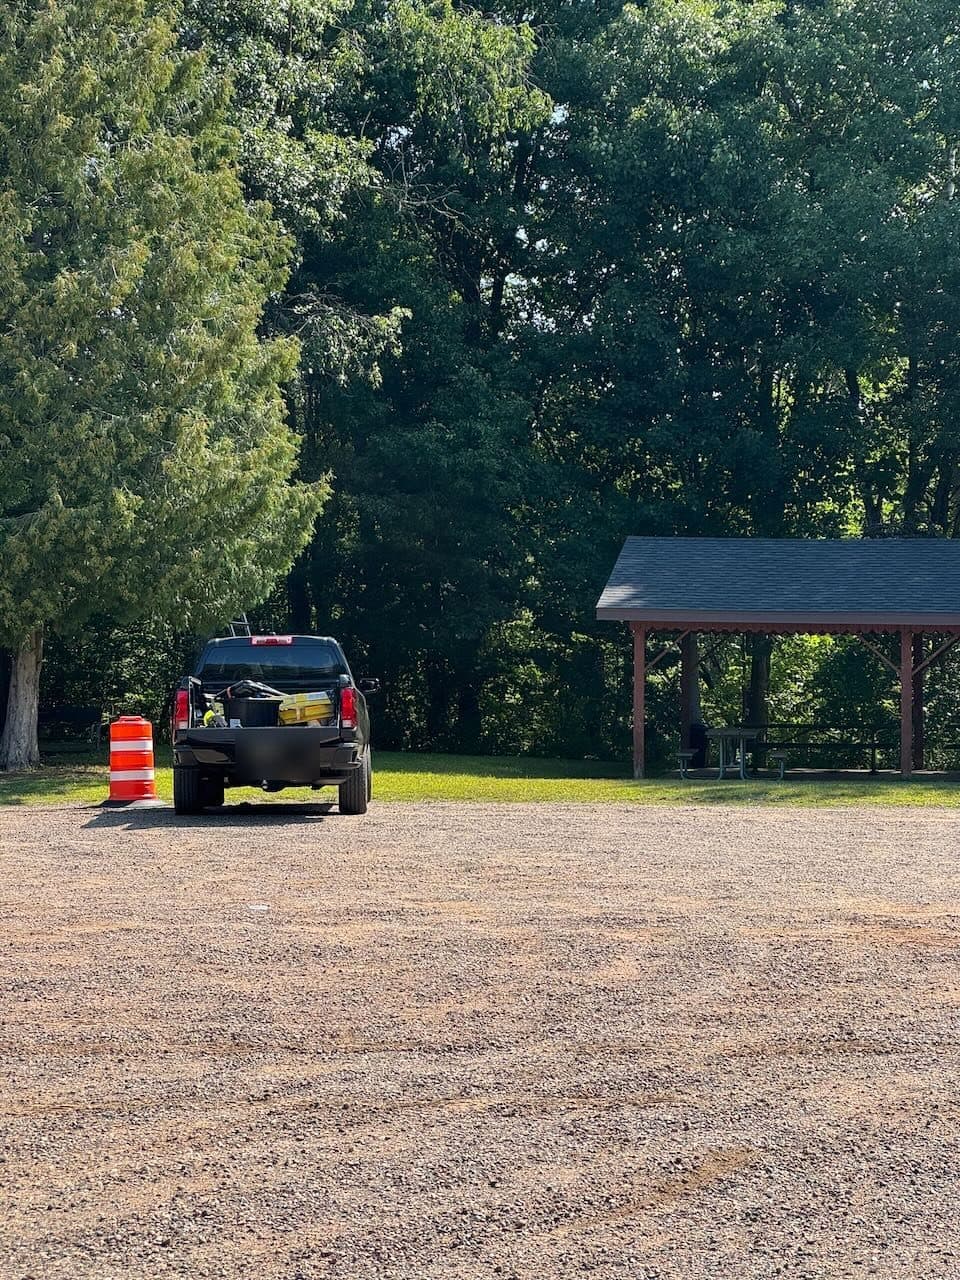
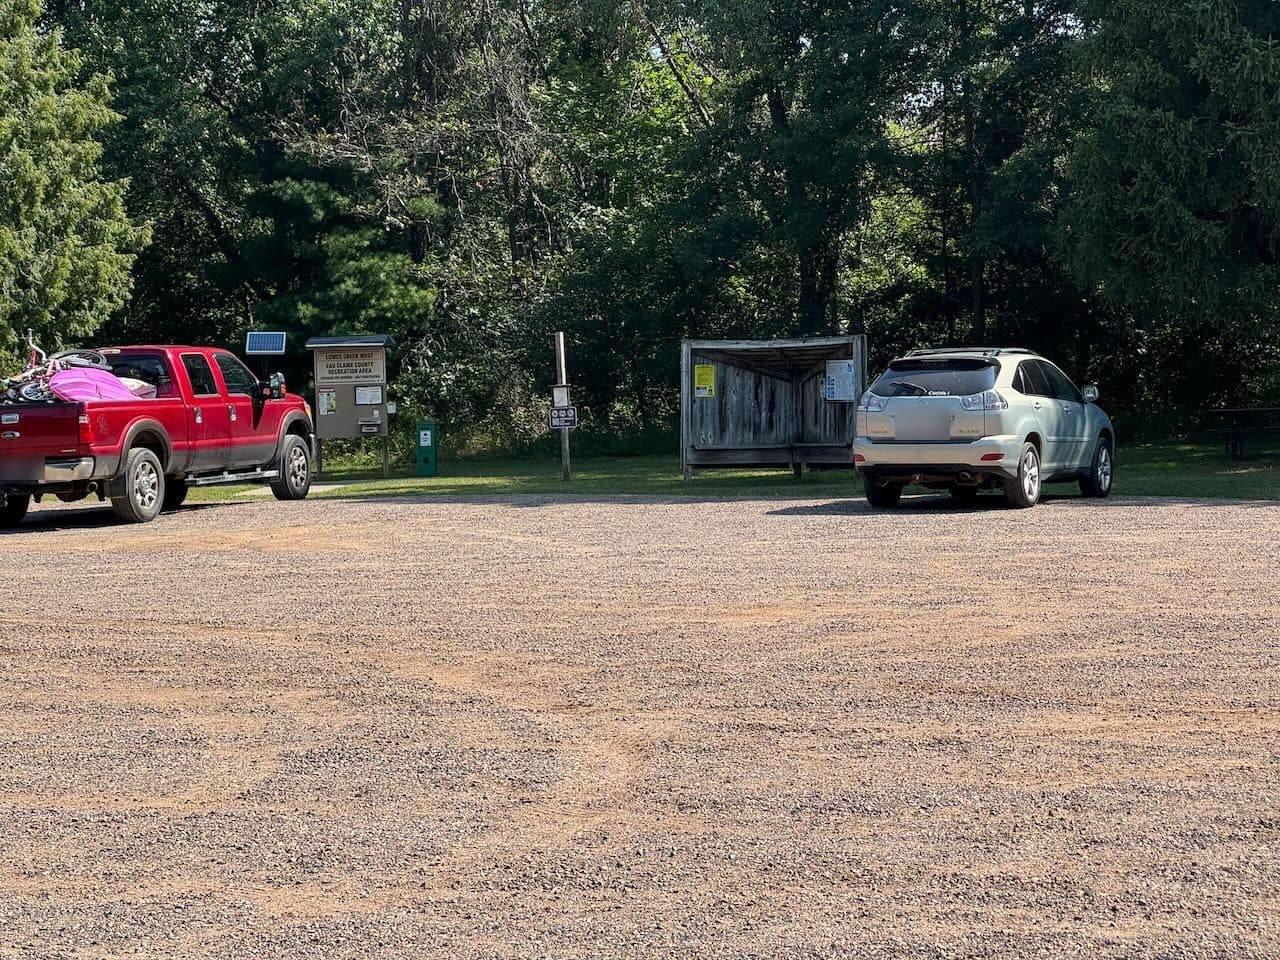
CORBA walked the park with Waypoint and picked four stations at the main access points. Each is a solar-powered cellular camera strapped to a tree 8 to 15 feet up, installed from a ladder in less than a day with no digging, wiring or vegetation removal. A CORBA-branded placard on each station explained the study and linked to more information.
The platform classifies every passage as a pedestrian, bicyclist, vehicle or other user, and blurs faces automatically. Nobody is identified. CORBA had its own dashboard login for the whole pilot, with counts by station, by hour and by activity type, and the photos behind every number. Read more about multimodal activity classification and privacy and security.
05 · Results
Three in four trail users were on foot
Over 65 days, the four stations analyzed about 12,000 detected subjects and counted 7,294 passages. 77% were pedestrians and 16% were bicyclists. For a park best known as a mountain biking destination, that surprised everyone. Walkers, runners and dog walkers are the majority of its users, and any plan for the trails has to work for them too.
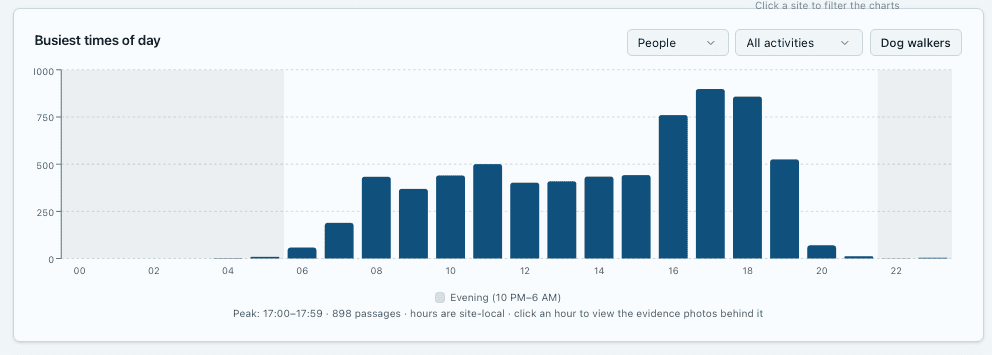
Use was far from even across the park. One entrance, Site 3, carried the most traffic, about 56 passages a day, against roughly 19 a day at the quietest station. The daily rhythm was clear as well: almost nothing before 6 a.m. or after 10 p.m., steady use through the day, and a peak from 4 to 7 p.m. The single busiest hour was 5 to 6 p.m., with 898 passages across the season.
- Pedestrian
- 77%
- Bicyclist
- 16%
- Other
- 7%
Other includes vehicles, maintenance vehicles, animals and ATVs. No skiers or equestrians were recorded in this season.
06 · Races and crowds
Separating everyday use from race days and picnics
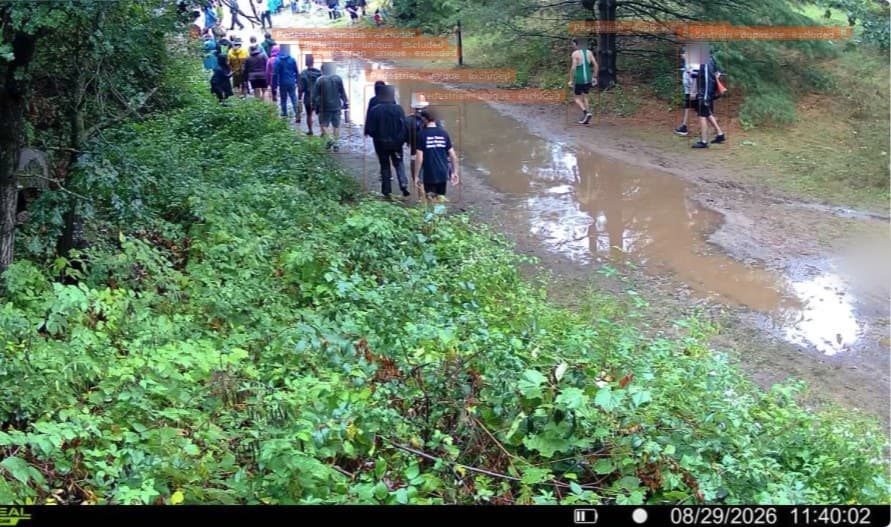
Because every count comes with its photos, unusual days were easy to see and explain. The pilot picked out high school running events, large family gatherings and, on Saturday, August 29, a race that brought a stream of participants past Site 3.
CORBA’s feedback led to a new tool: exclusions, which remove a site and time window from the counts while keeping the photos for the record. The race-day exclusion at Site 3 removed 2,655 passages, out of 6,006 counted there all season. Left in, that one day would have made up 44% of that entrance’s total.
Activity is not occupancy
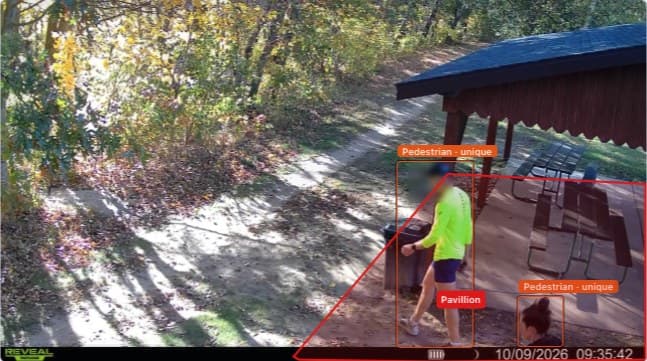
Site 5 watches a trail that runs past a picnic pavilion. People sitting at the pavilion were counted again and again as they came and went, which says nothing about trail use. Drawing the pavilion as an excluded zone fixed it: in the week of Oct 3 to 9, Site 5’s count fell from 627 to 182 people once the pavilion was left out.
Zones and exclusions are now part of the Waypoint platform for every project. See how noise filtering is validated.
07 · What it means for CORBA
A baseline CORBA can plan and fundraise on
Who the park serves
Pedestrians outnumber riders nearly five to one, which matters for shared-use design, signage and trail etiquette.
Where investment lands
Entrance-by-entrance traffic shows which trailheads carry the load and where parking and wayfinding pay off.
Clean, defensible numbers
Races and picnics are excluded but documented, so totals in a grant or board report stand up to questions.
CORBA now has a season of classified, entrance-level counts for a park it is actively developing, and the dashboard stays available after the pilot. That gives the second phase of the bike park, and any future trail or trailhead work, a measured starting point, and a way to show afterward what changed.
The pilot also shaped the product. Besides zones and exclusions, CORBA’s feedback led to weather shown alongside daily counts, tools to add, edit or remove a detection, and alerts such as low battery.
08 · Lessons learned
What we learned
- 01
Don’t assume the user mix.
A park’s reputation reflects its most visible users. Classifying every passage showed a majority that a bike-focused count would have missed.
- 02
Plan for events before they happen.
Parks that host races will see a few days that dwarf the rest. Keep them, label them and exclude them from everyday averages.
- 03
Separate trail use from people staying put.
A camera near a shelter or bench counts the same people repeatedly. A drawn exclusion zone keeps the count about movement on the trail.
09 · Sources
Sources
- Eau Claire County Parks & Forest, Lowes Creek County Park
- Eau Claire County Parks & Forest, Mountain Bike Trails
- Eau Claire County Parks Master Plan, Strategic Implementation Plan (Ayres Associates, May 2023)
- Volume One, Proposed Lowes Creek Bike Park organizers seek community input (Apr. 25, 2023)
- Chippewa Off Road Bike Association, Lowes Creek Bike Park Launch Fund (GoFundMe, Feb. 2023)
- Volume One, Wheels roll on Lowes Creek bike skills park plan (Oct. 3, 2023)
- Volume One, Beginner-friendly bike skills park opens at Lowes Creek (June 24, 2024)
- WEAU 13 News, Adventure Playground bike skills park opens (July 13, 2024)
- WEAU 13 News, Lowes Creek trails to close for Husky Invite cross country race (Aug. 27, 2025)
- WEAU 13 News, Lowes Creek trails to close during mountain bike race (Sept. 2, 2025)
Counts come from the Waypoint Analytics platform for the CORBA Lowes Creek pilot, Aug 6 – Oct 9, 2026, with race-day and pavilion exclusions applied.