
01 · The challenge
Winter visits are inferred from summer counts
Three Rivers counts carefully. Every summer, staff and volunteers run two-hour counts at more than 550 park and trail entrances, alongside vehicle counters, trail counters, sales data and visitor surveys.[5] Those counts feed the Metropolitan Council’s annual estimate, which put Three Rivers at 14.7 million visits in 2025.[7]
But the counts happen between Memorial Day and Labor Day. Winter, spring and fall visits are calculated from the summer numbers using survey multipliers.[6] For a park whose winter is built around skiing, that leaves the busiest season for some trails as an estimate. Three Rivers wanted to see what direct winter counts could show: total use, the share of each activity, and how hard each entrance is used.
02 · Background
A suburban park reserve built for winter
Three Rivers Park District has run parks in the west metro since 1957 and manages more than 27,000 acres of park reserves, regional parks, regional trails and special-use facilities.[2][1] Hyland Lake Park Reserve in Bloomington is part of the 2,565-acre Hyland-Bush-Anderson Lakes Park Reserve. In winter it has 9.5 miles of cross-country ski trails groomed daily for classic and skate skiing, five miles of them lit, ski and snowshoe rentals, the Hyland Hills Ski Area, and Richardson Nature Center. Hiking on the ski trails is not allowed in winter.[3]
1957
The Park District is created.[2]
February 17, 2026
First full day of data from 8 cameras around Hyland Lake Park Reserve: four at park entrances, two on ski trails and two at trail crossings.
February 21, 2026
Winter Play Day: free cross-country ski passes and rentals, snowshoeing, kicksleds and ski lessons at Hyland.[4]
March 3 – 14, 2026
A Waypoint camera runs side by side with an Eco-Counter MULTI infrared counter.
March 2026
A thaw in the first week of March, then snow again mid-month: depth at MSP peaks at 8 inches on March 16. The month ends 5.8°F above normal, with a record 79°F on March 21.[8][9]
03 · The approach
Eight cameras, ten feet up, in February snow
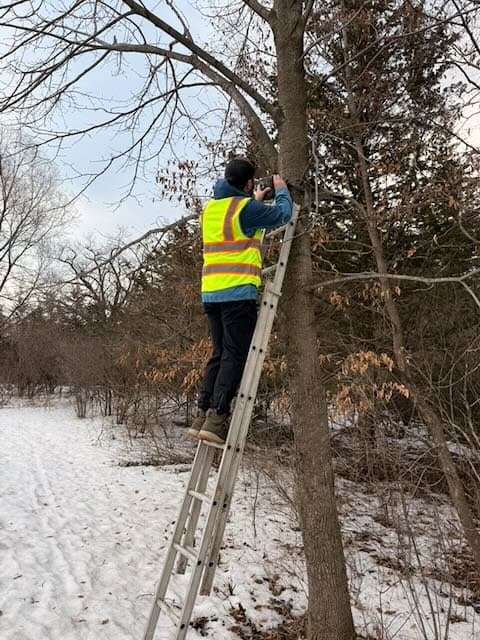
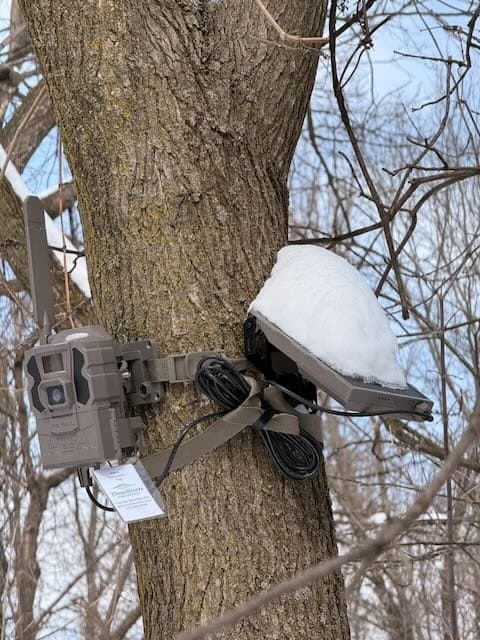
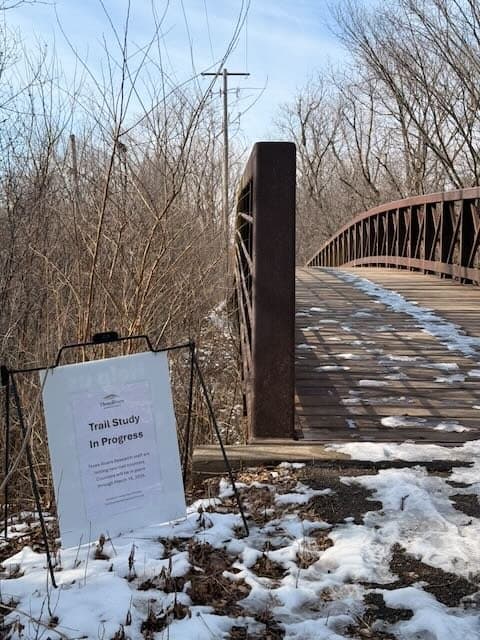
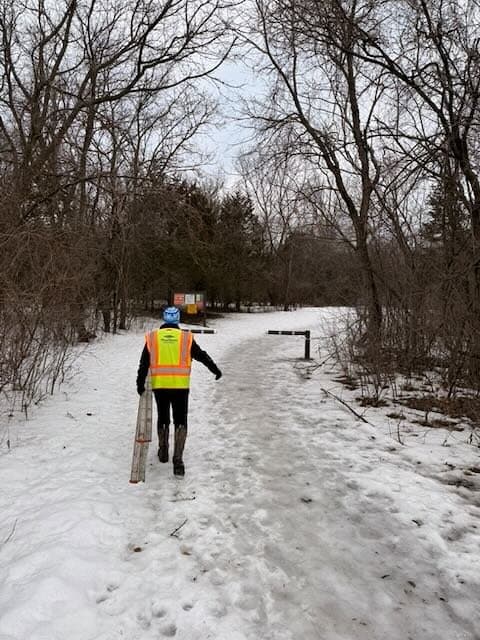
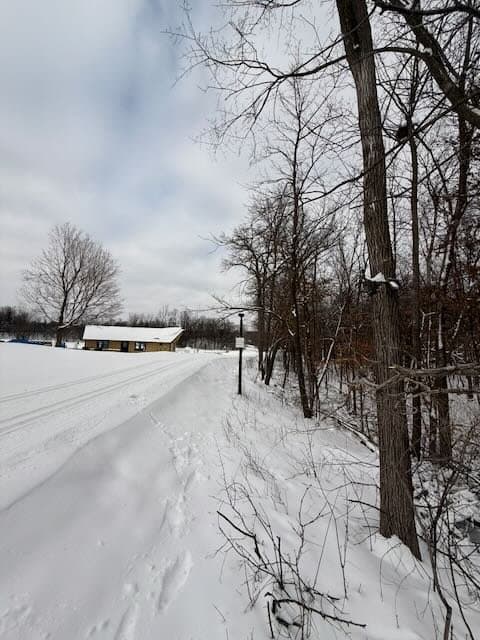
Waypoint placed 8 solar cellular cameras across the park: four at park entrances, two on dedicated ski trails and two at crossings where trails meet. Each was strapped to a tree about ten feet up from a ladder, with no power, trenching or permanent hardware. A Three Rivers tag on each camera and signs at the trailheads told visitors a trail study was under way.
Every passage is classified by activity, such as skiing, walking, walking a dog or riding a fat bike, faces are blurred automatically, and each count links to the photo behind it.
04 · What the winter showed
22,514 passages, a family ski day, and skiing that follows the snow
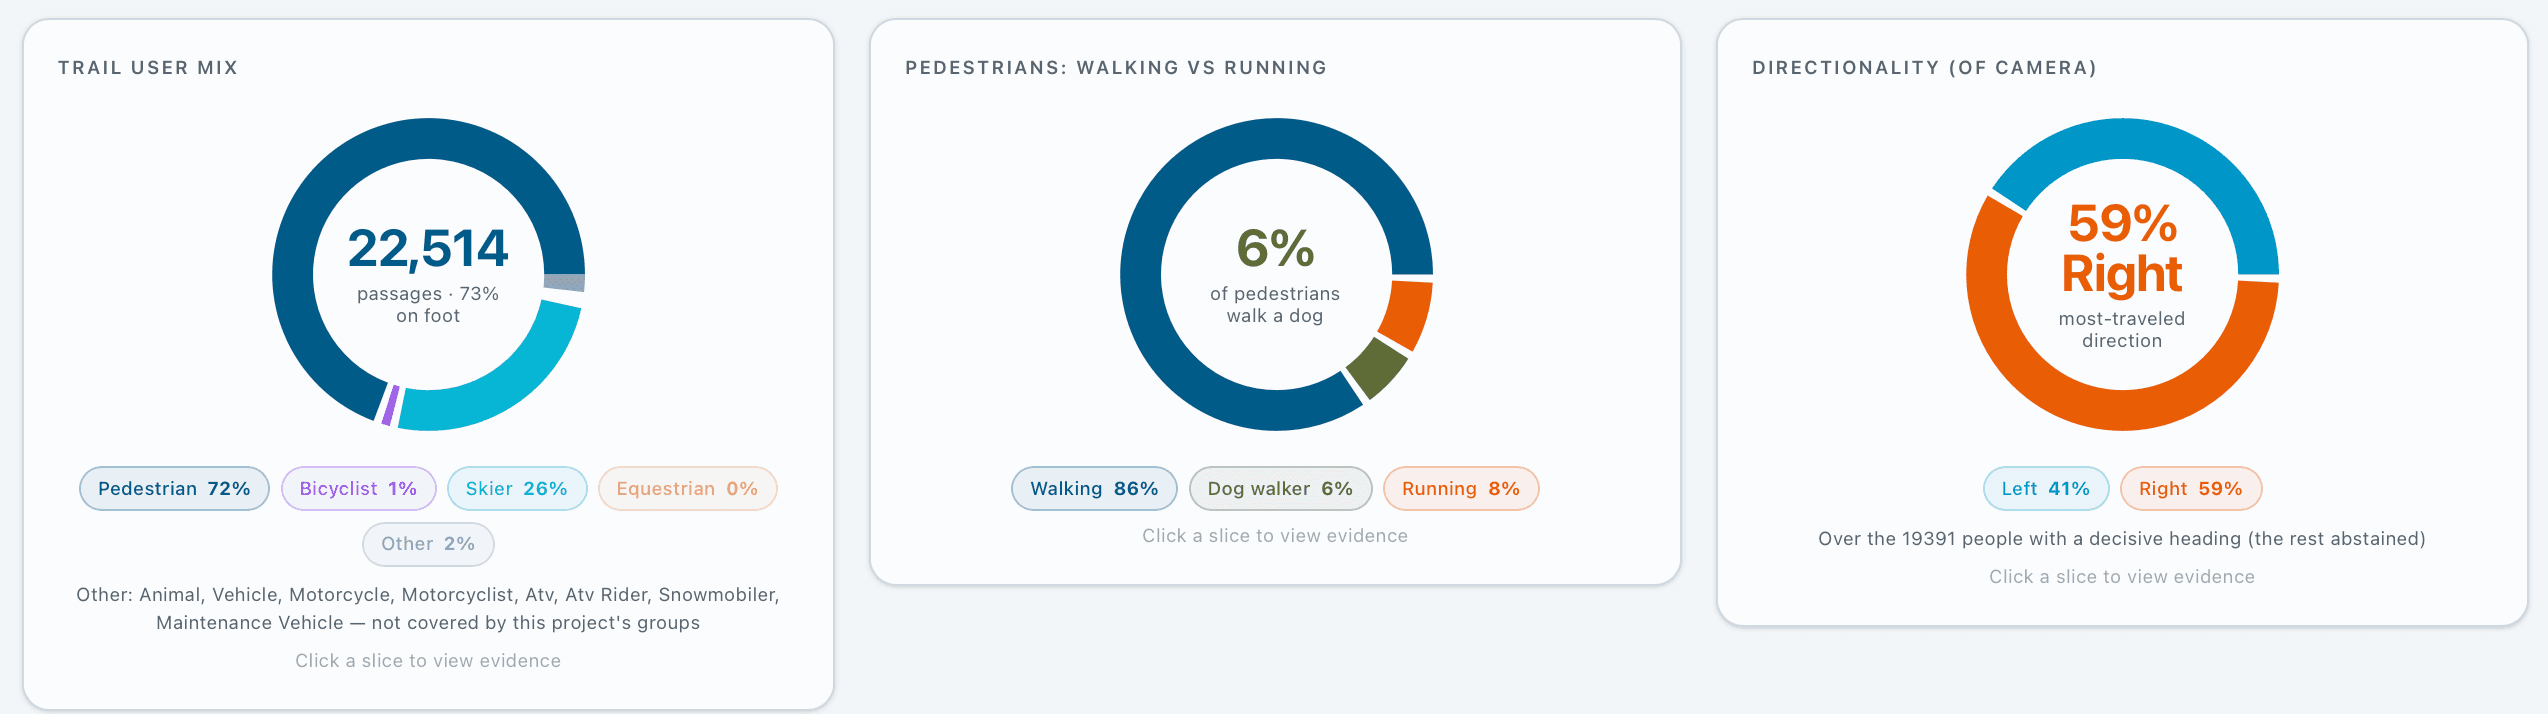
In 28 days the eight cameras recorded 22,514 passages. 72% were on foot and 26% on skis; bicyclists, vehicles, snowmobiles and animals made up the rest. Among pedestrians, 6% walked a dog and 8% were running, and 27% of people were in a group. The busiest site, Site 4 near the center of the park, carried 9,646 passages, more than the five quietest sites combined.
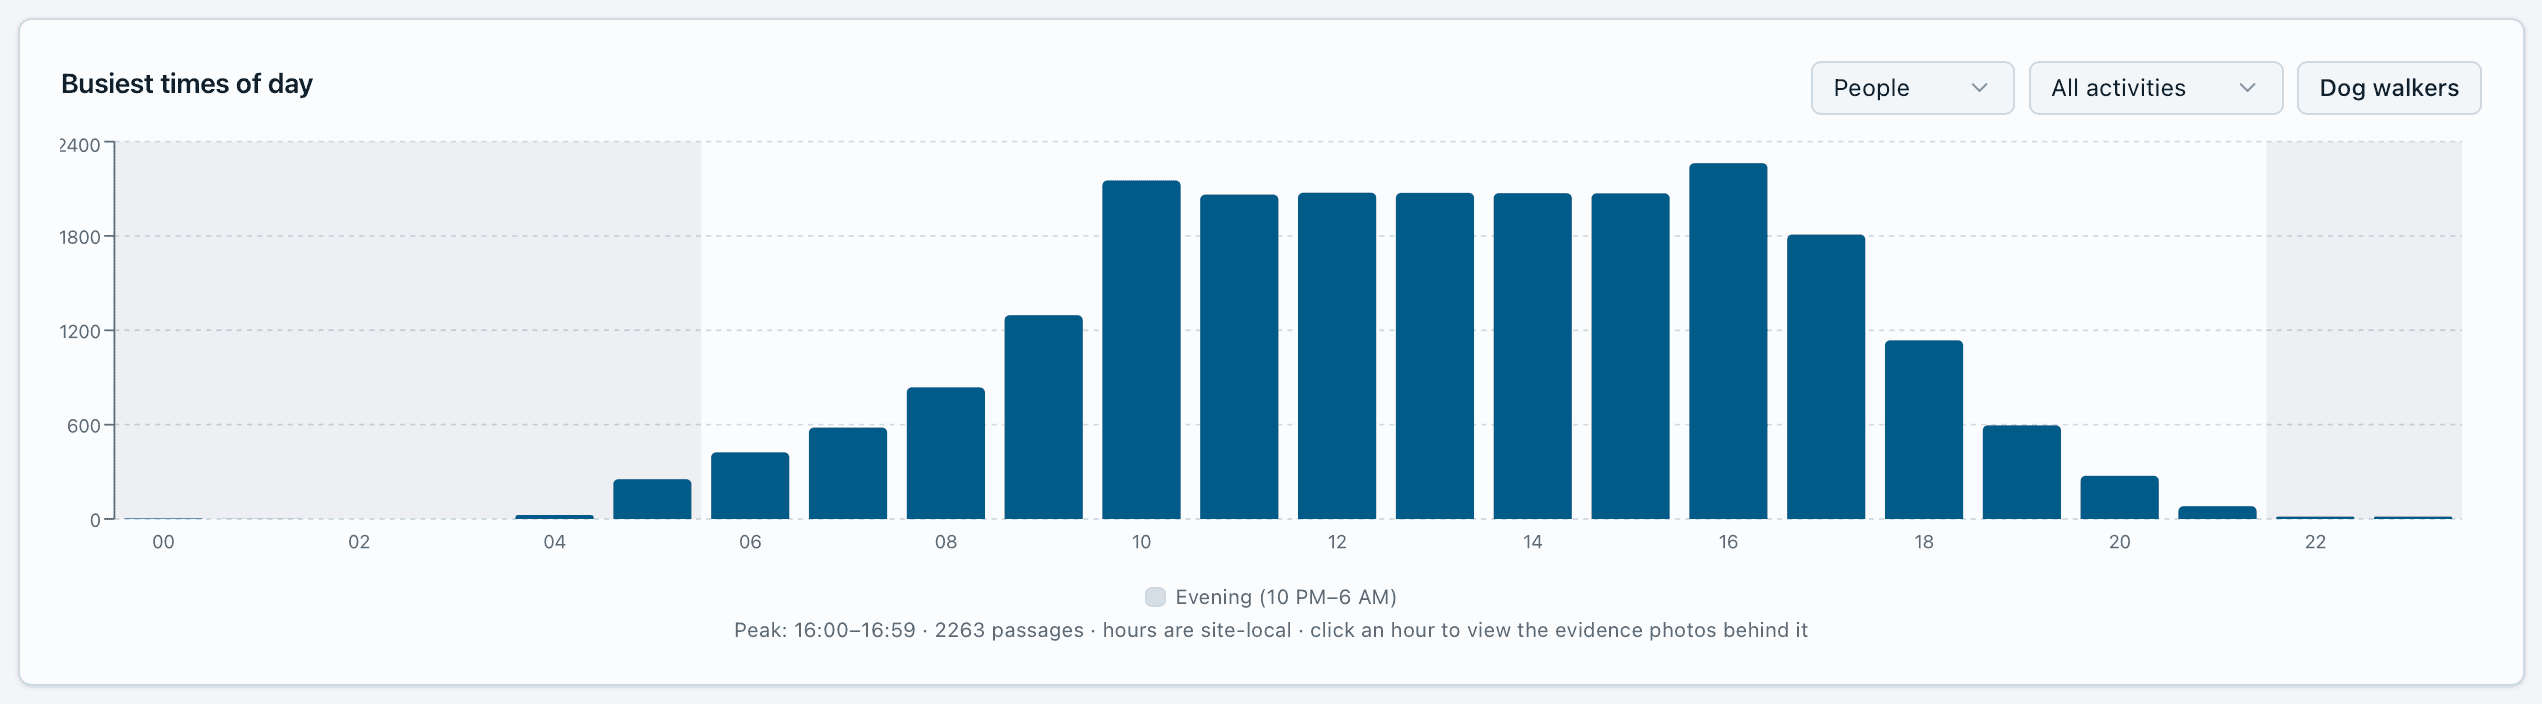
Use built from mid-morning and held steady from 10 a.m. to 5 p.m., peaking between 4 and 5 p.m. with 2,263 passages across the pilot, as people came out after work and school.
Trail user mix, all sites
- Pedestrians 72%
- Skiers 26%
- Bicyclists 1%
- Other 2%
Winter Play Day
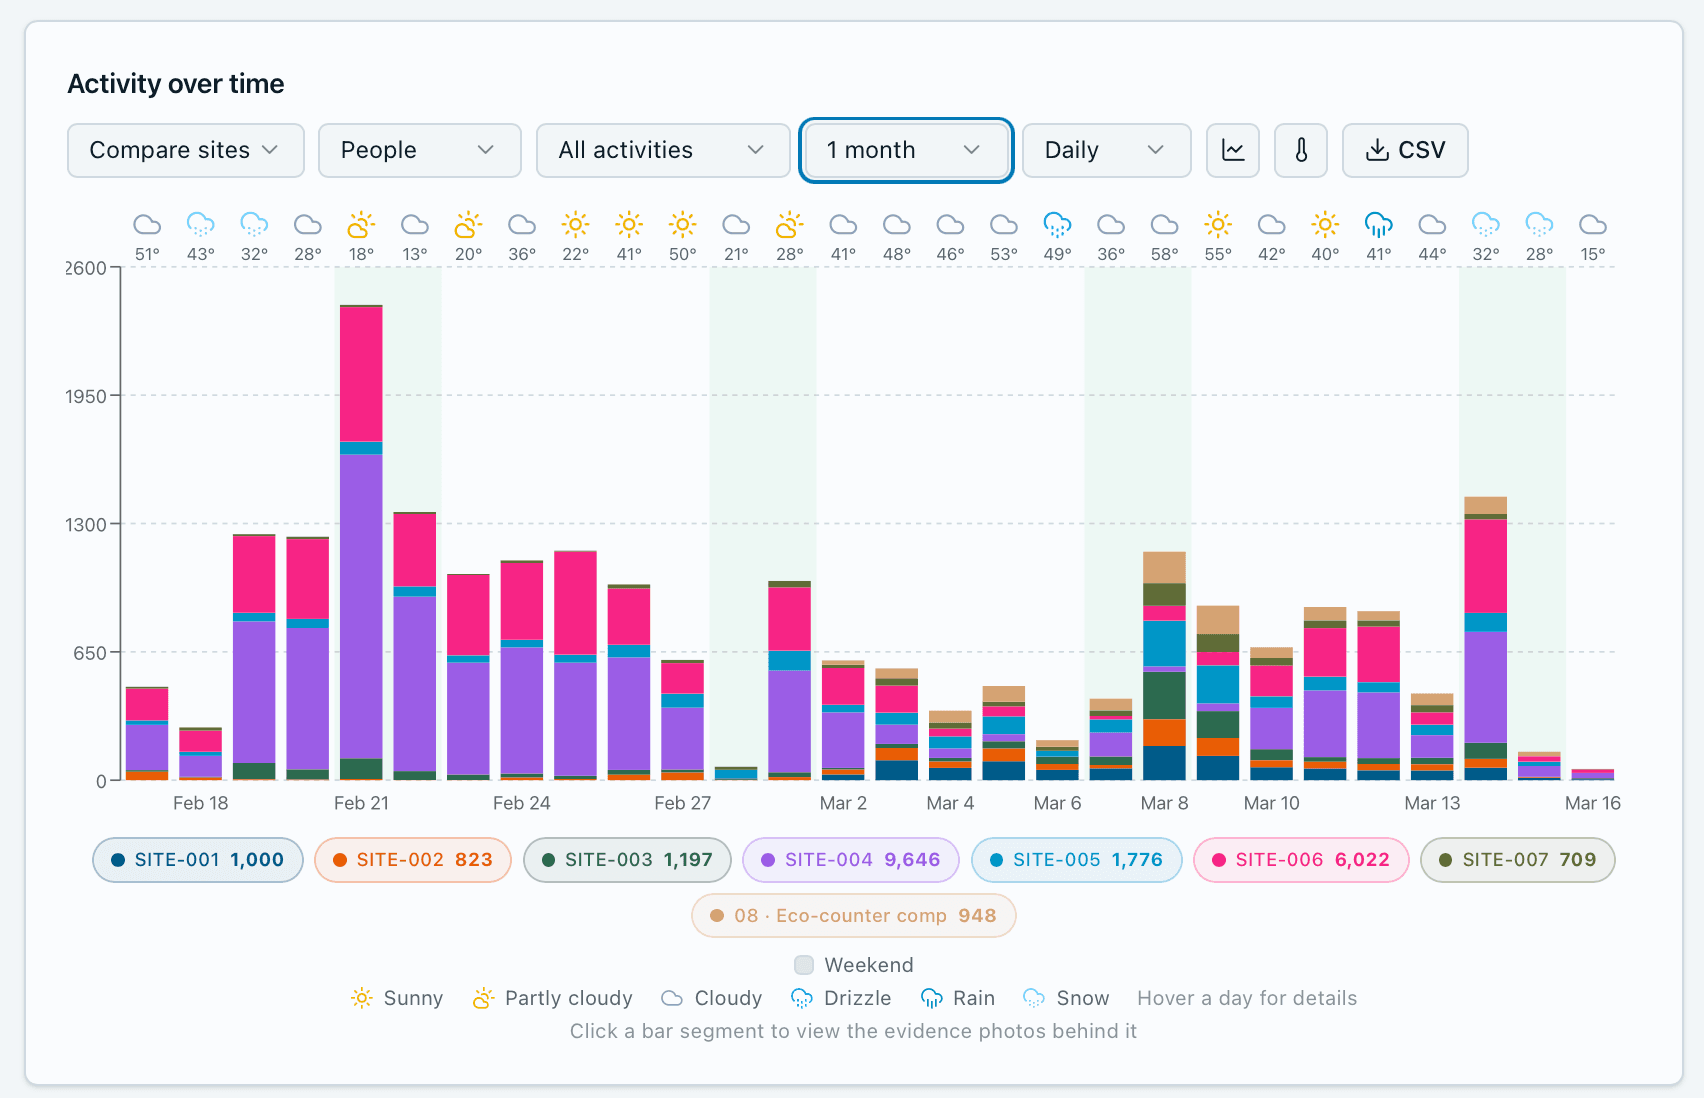
On Saturday, February 21, Three Rivers’ Winter Play Day offered free cross-country ski passes and rentals at Hyland.[4] The park recorded about 2,400 passages that day, the busiest of the pilot and roughly twice a typical day, most of them at Site 4. Because each count has a photo behind it, the park can report the festival on its own and keep it out of everyday averages.
Skiing follows the snow
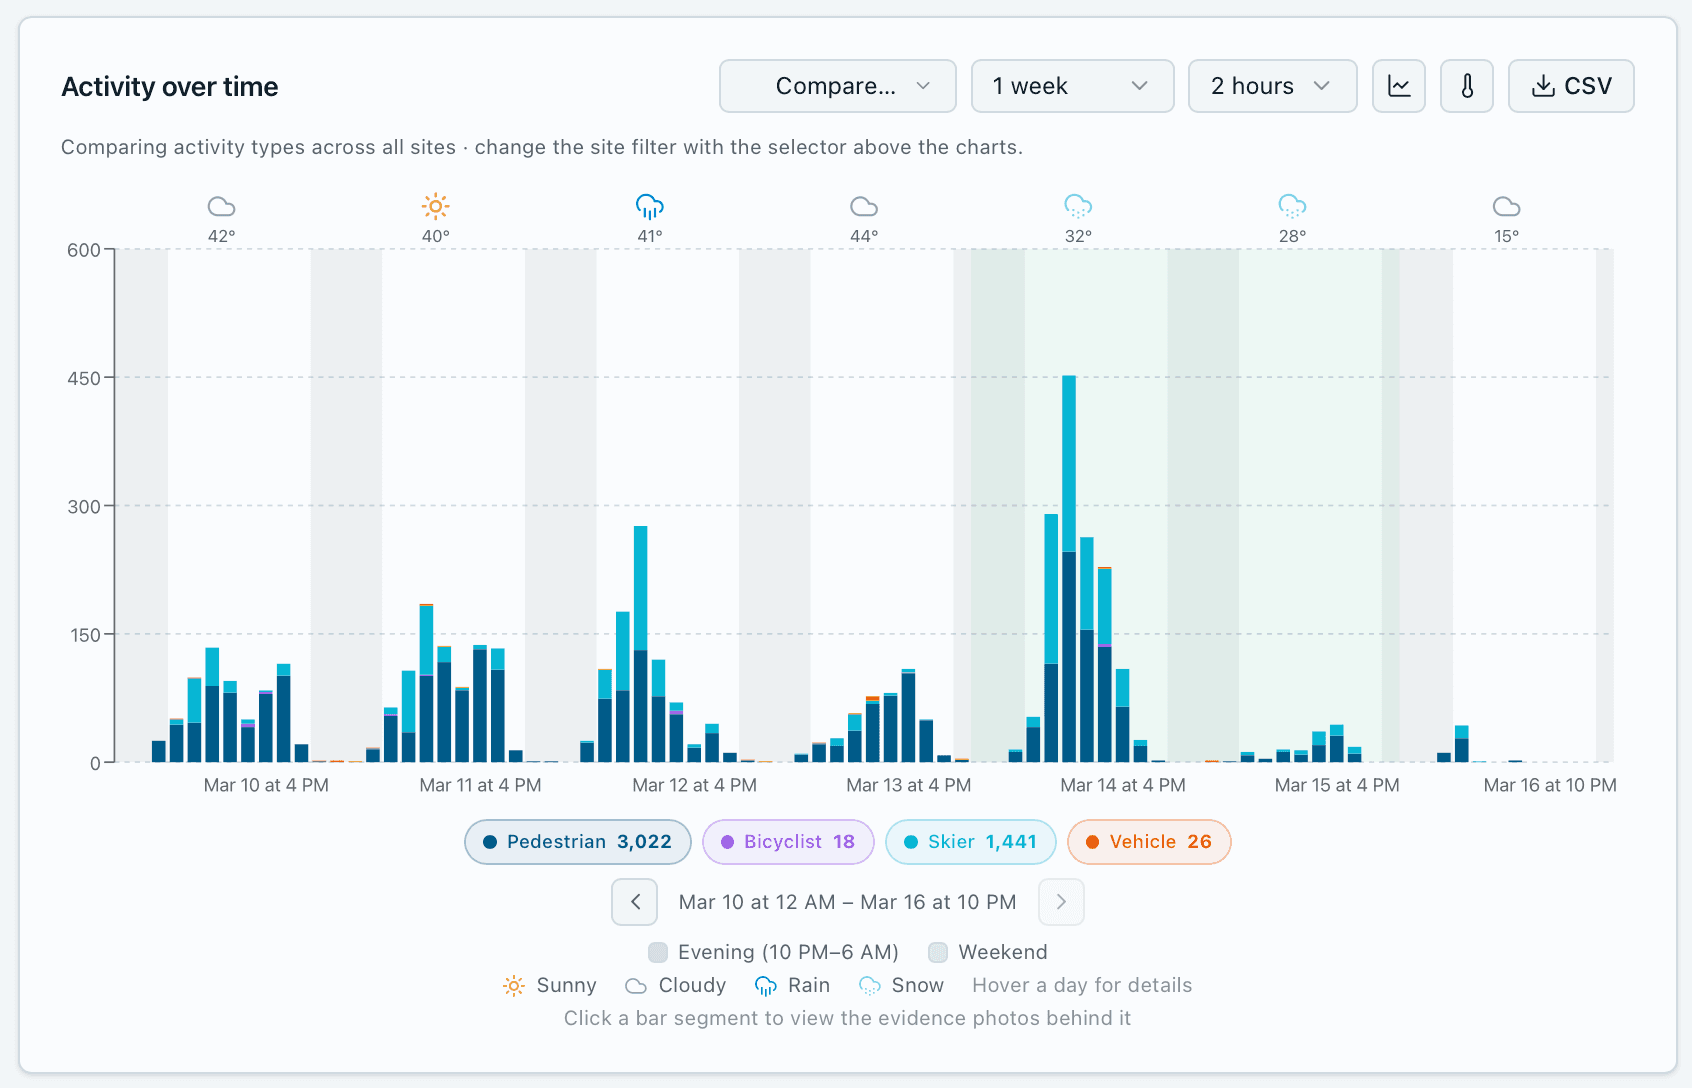
In the first week of March, highs reached the 40s and 50s and the trails softened. At Site 6, on the ski trails, skiing almost disappeared: on several days the camera counted only a few dozen people, nearly all on foot. When snow returned mid-month, so did the skiers. On Saturday, March 14, the park’s busiest two hours of the week saw about 450 passages, more than half of them on skis.[8]
Weather sits beside each day’s numbers in the dashboard, so Three Rivers can see how much of a winter season depends on snow and grooming, not just on demand. That is something a multiplier applied to summer counts can’t show.
05 · Activity share by trail
Activity share, trail by trail
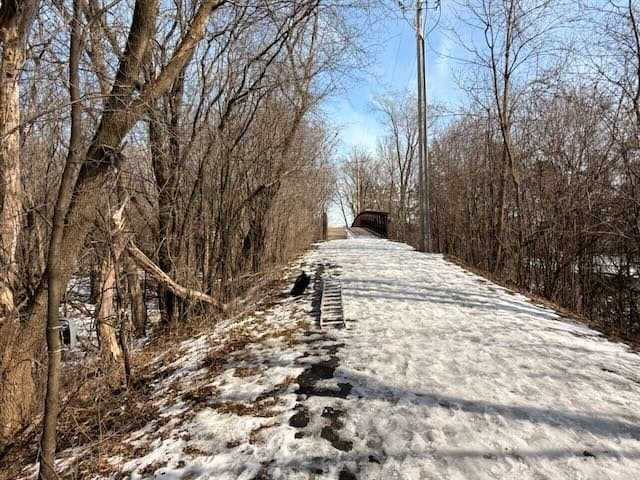
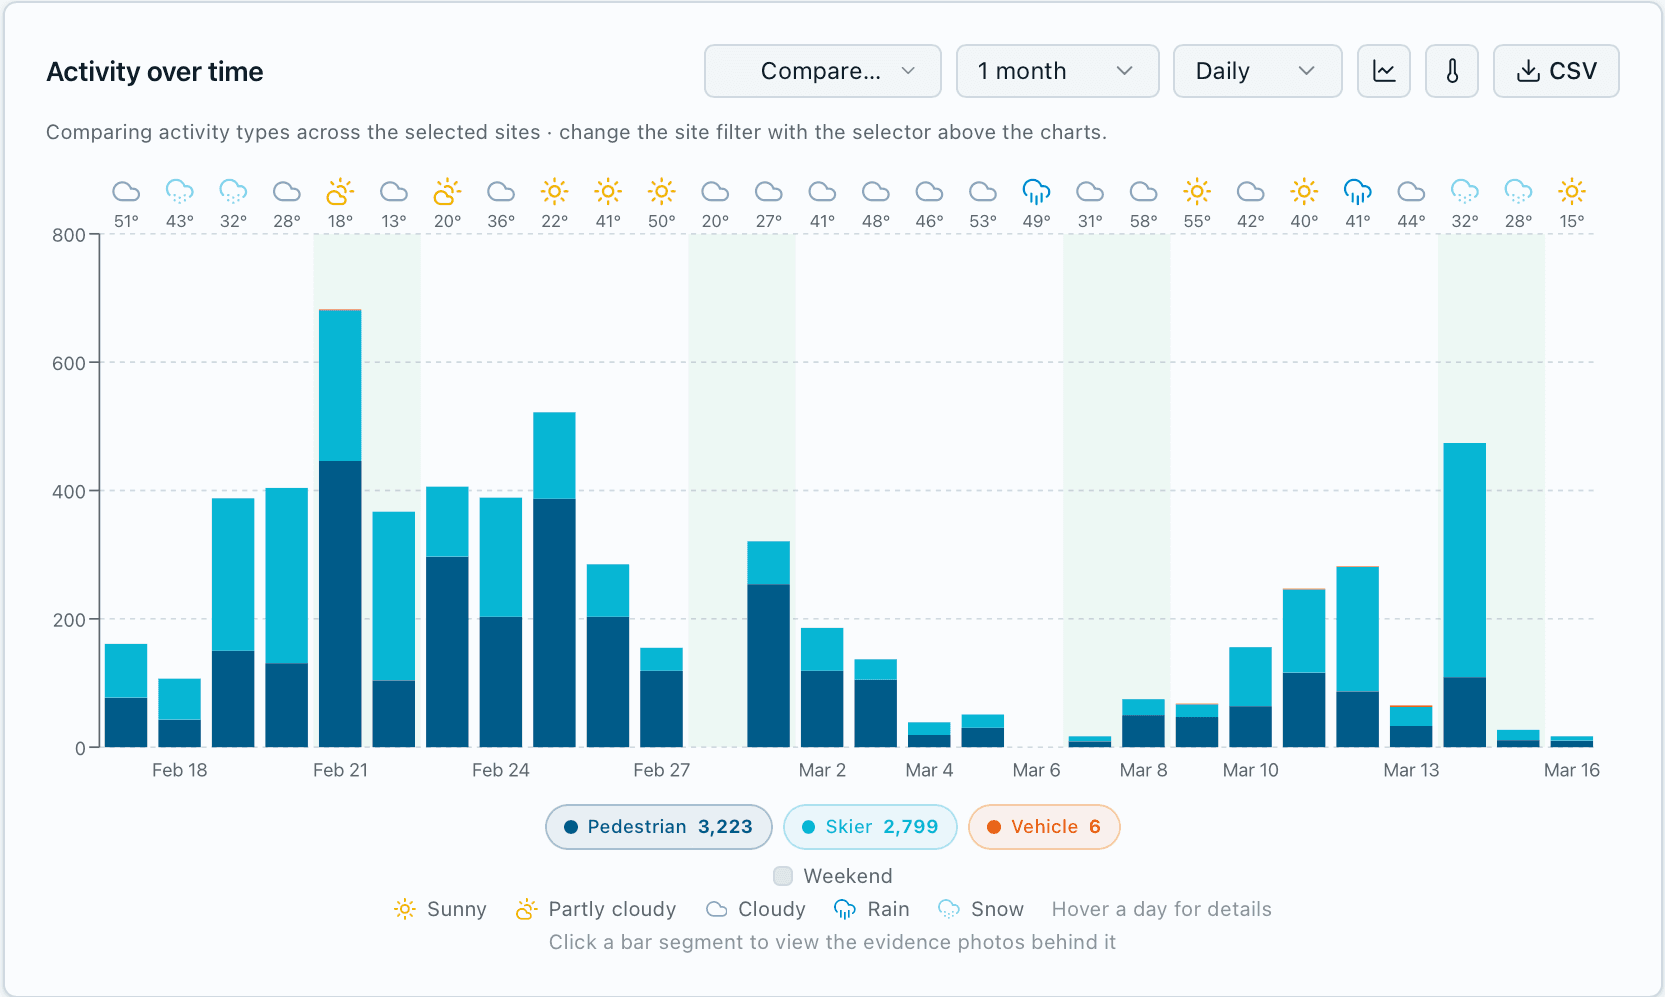
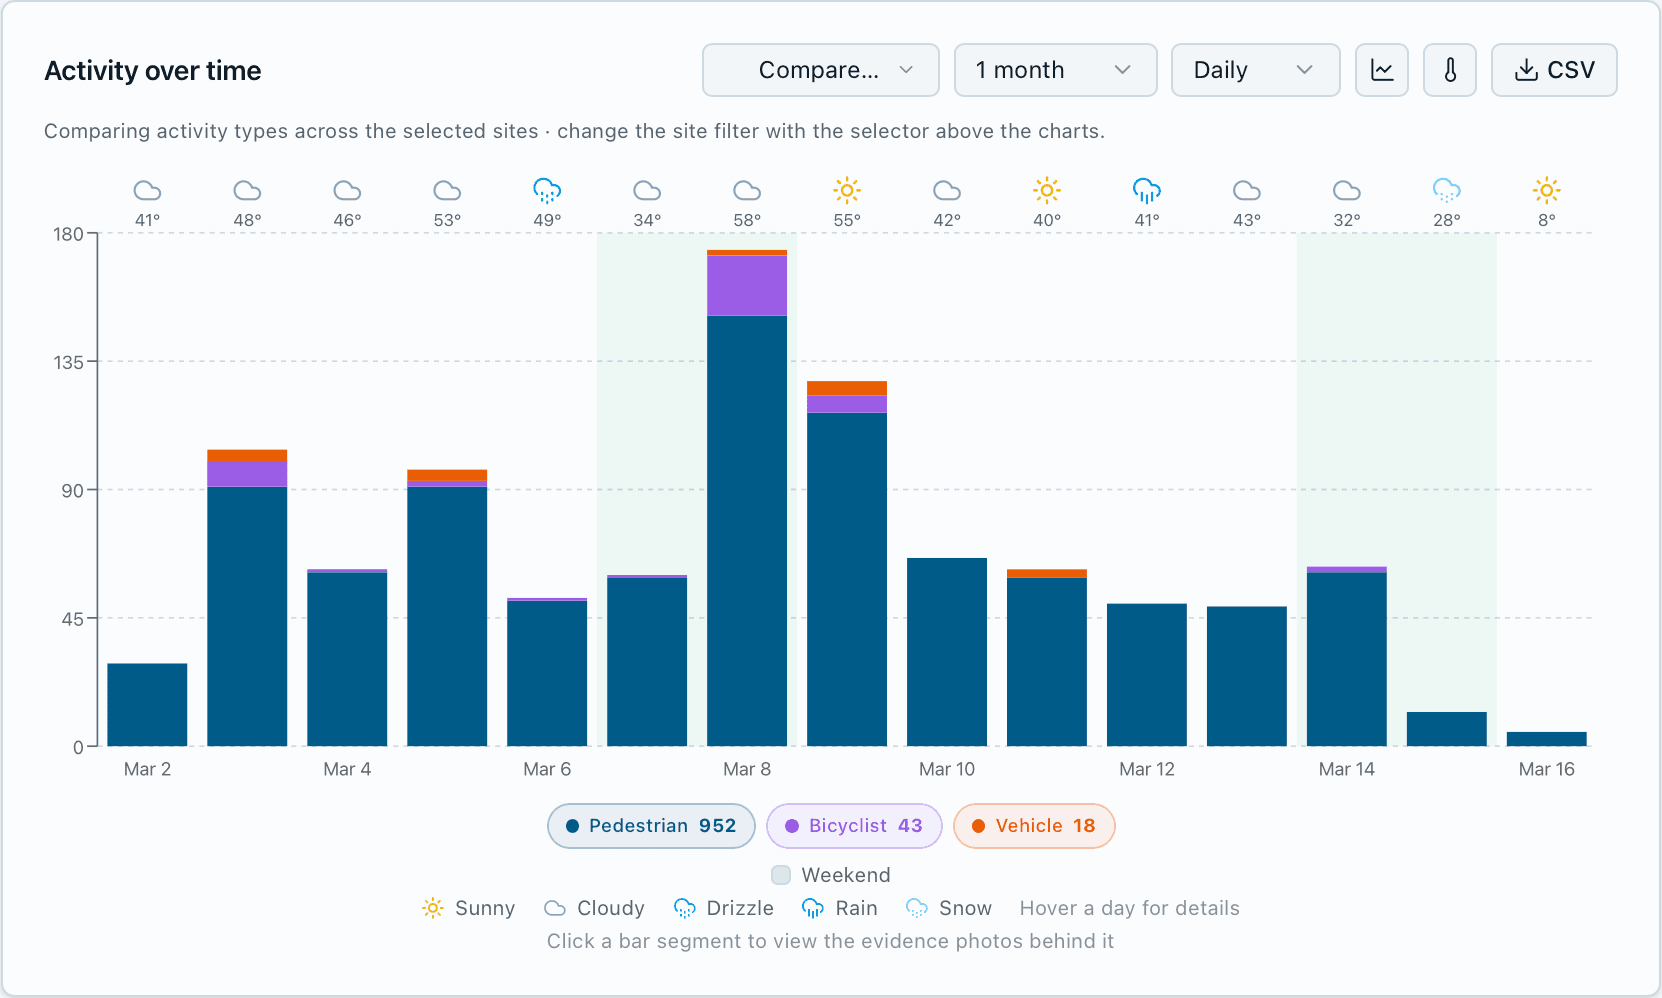
A park-wide total hides how different each trail is. Site 6 watches a trail with groomed ski tracks; Site 1 watches a trail with no ski tracks. At Site 6, 46% of passages were skiers. At Site 1, there were none: 94% pedestrians, plus a few bicyclists and vehicles.
Because the cameras classify every passage by activity, Three Rivers can see the share of skiing, walking and biking at each entrance and trail, not just how many people went by. That is what grooming, signage and winter trail-use rules are decided on.
Site 6
Trail with groomed ski tracks, Feb 17 – Mar 16 · 6,028 passages
- Pedestrians3,223 53%
- Skiers2,799 46%
- Vehicles6 0%
Site 1
Walking trail with no ski tracks, Mar 2 – 16 · 1,013 passages
- Pedestrians952 94%
- Bicyclists43 4%
- Vehicles18 2%
- Skiers0 0%
06 · Counting each skier once
The same skier, counted again and again
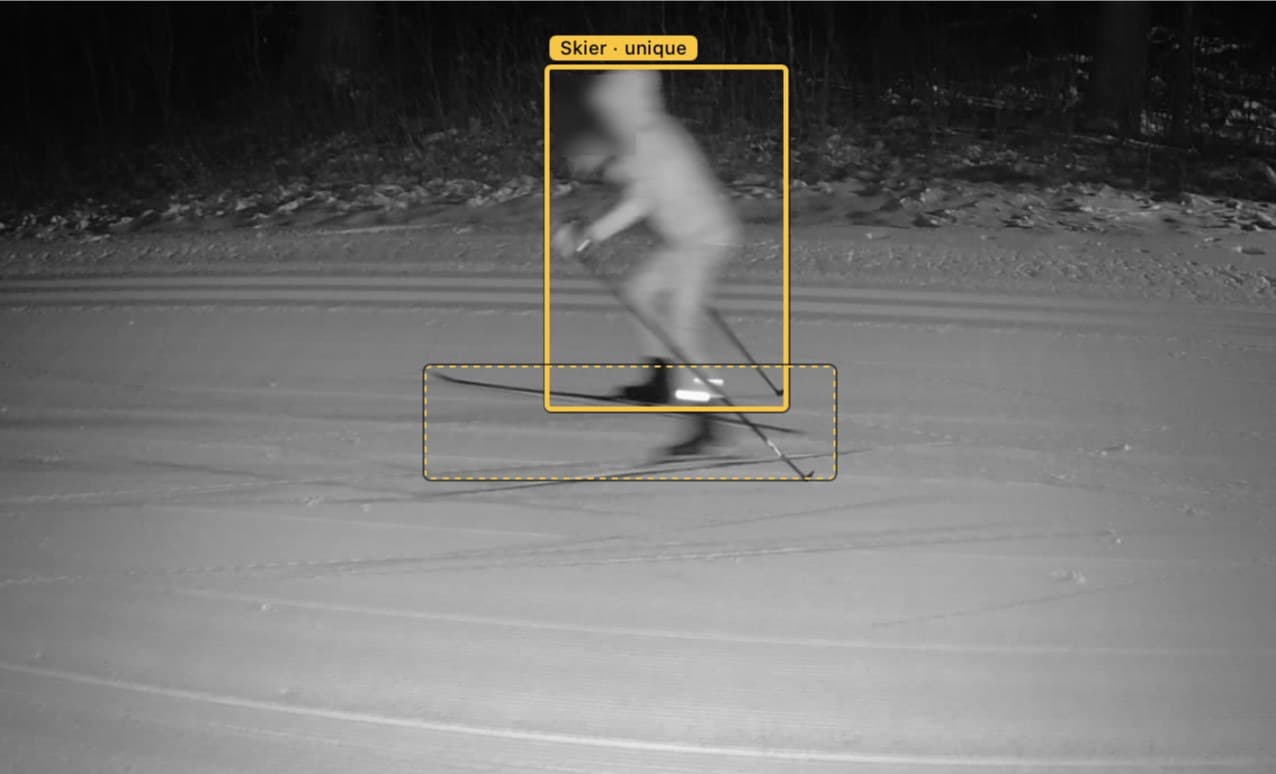
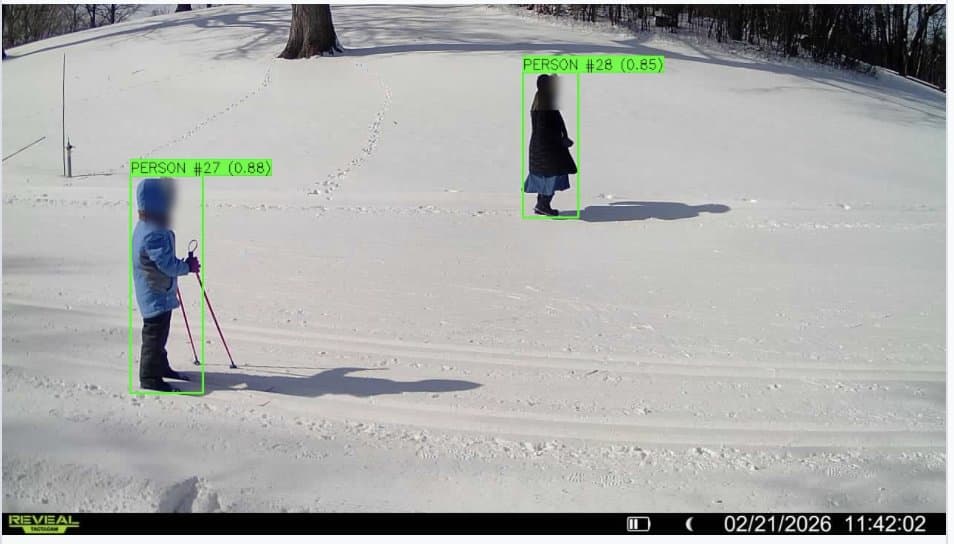
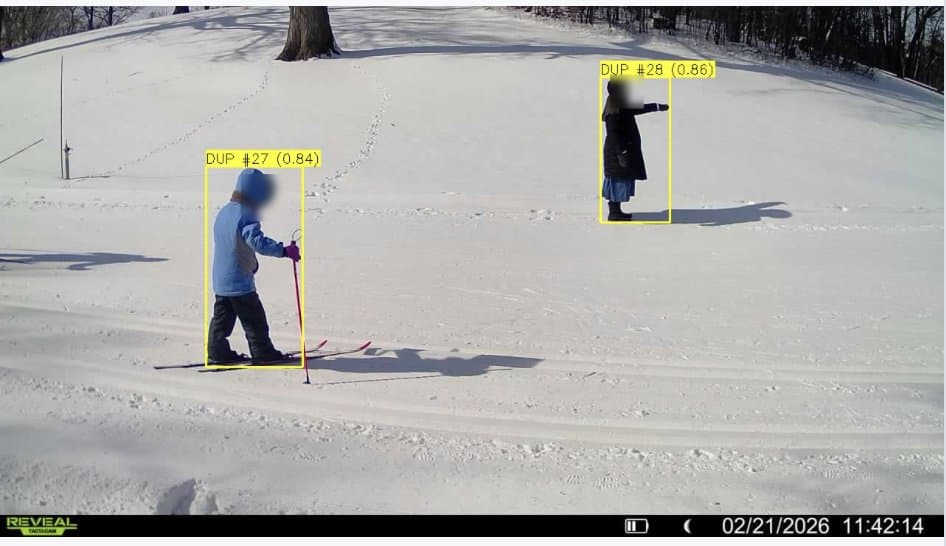
Winter Play Day exposed a problem. Children learning to ski stop, turn around and linger in front of a camera, which triggers it again and again. Early counts treated each photo as new people, so a few families could look like a crowd.
From this data Waypoint built a repeat-subject filter. It compares each detection with the ones in the photos just before it and marks a person already counted as a duplicate instead of a new visitor. It cut false counts from repeat subjects from 31% to 3%. See how noise filtering is validated.
07 · Against an IR counter
Side by side with an infrared counter: in step, but not equal
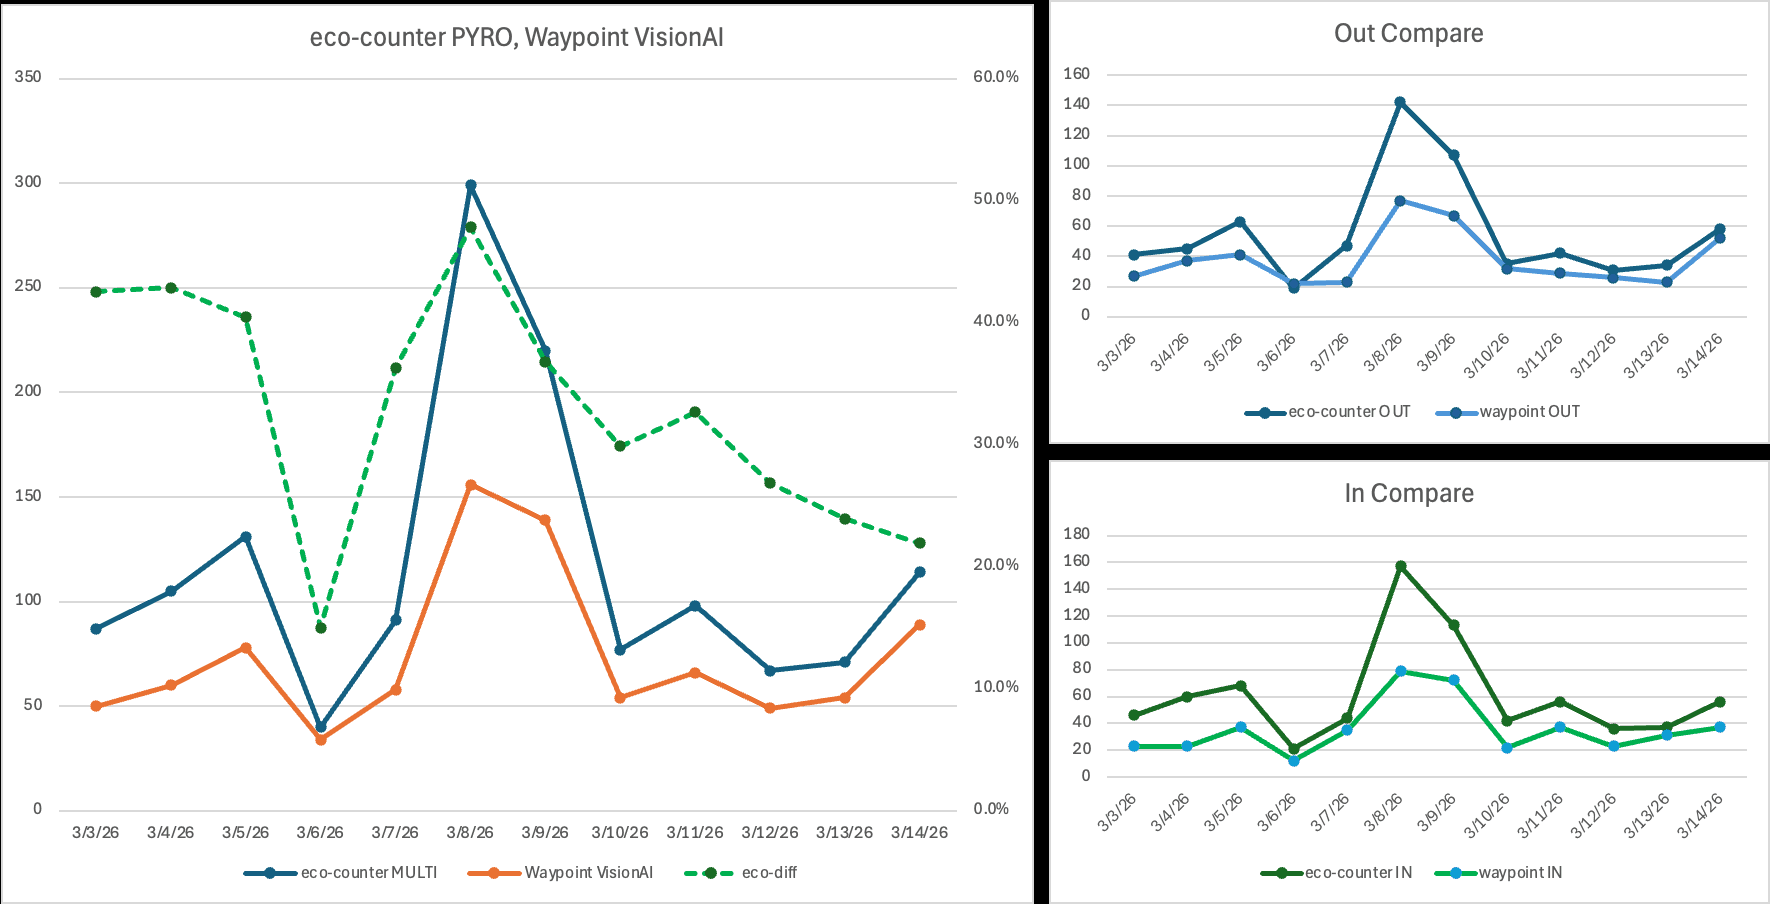
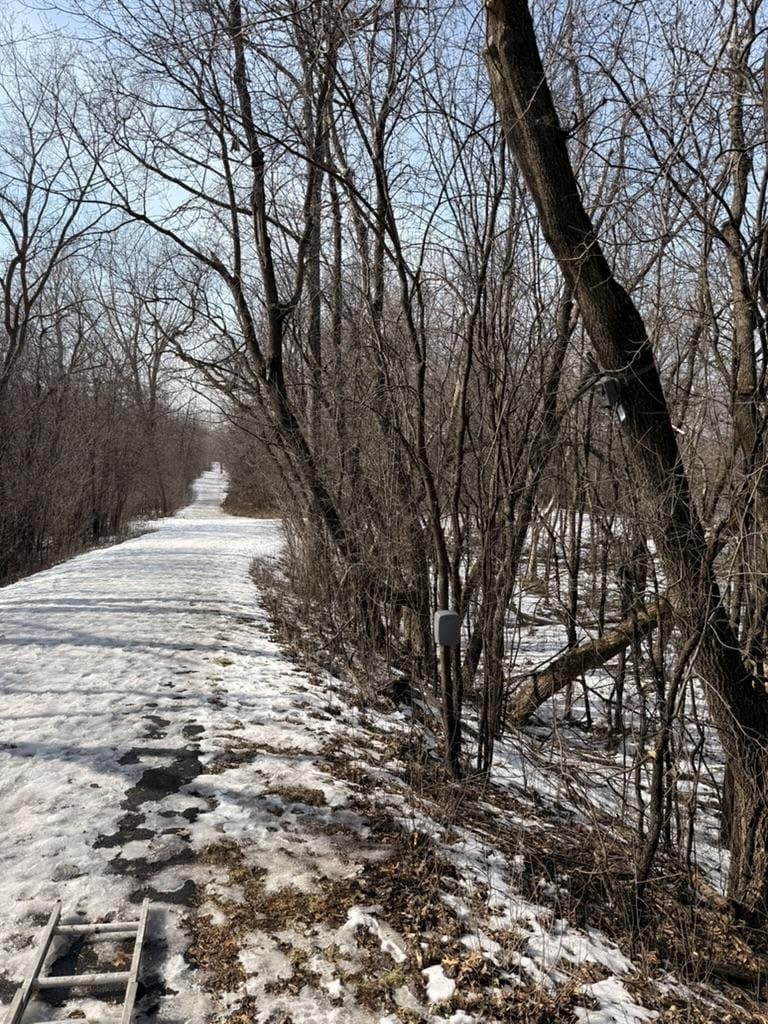
From March 3 to 14, a Waypoint camera ran beside an Eco-Counter MULTI infrared counter on a narrow, four-foot trail, through dry ground and deep snow, 20°F to 80°F, day and night, with walkers, skiers, cyclists, dog walkers and animals.
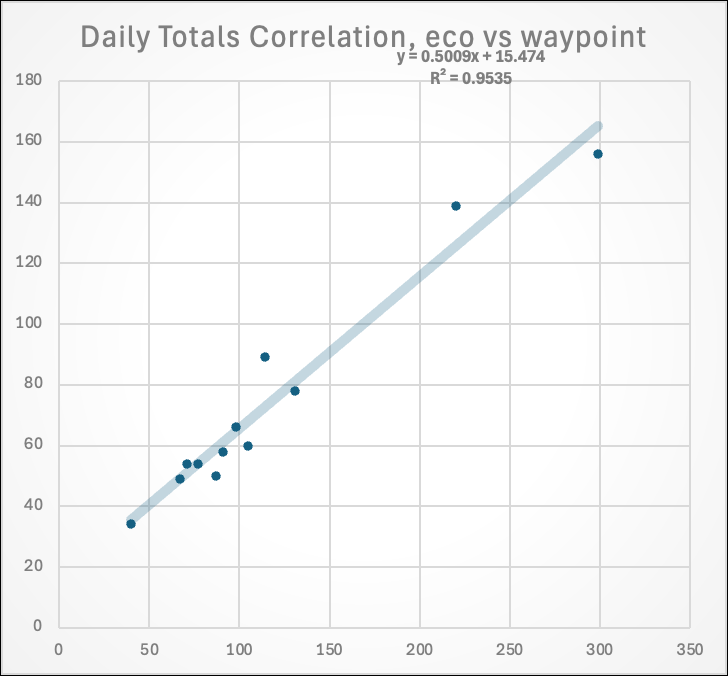
Day by day the two counters rose and fell together: their daily totals correlated with an R² of 0.95. But the camera counted about half as many as the infrared counter. Without manual counts there was no way to tell whether the infrared counter was overcounting or the camera undercounting. That open question led to the next study, with MnDOT on the Nine Mile Creek trail bridge, where a better-placed camera came within 7–12% of an infrared counter.
The comparison also changed the software. Waypoint raised detection confidence thresholds, added a direction-of-travel model, tuned the camera’s trigger timing to avoid early and late captures, and fine-tuned its detector for groups. See how directional counting works.
08 · What came out of it
A pilot that reshaped the product
Winter, counted
Direct counts of skiers and other winter users by site, instead of a multiplier on summer counts.
Each person once
A repeat-subject filter that cut false counts from 31% to 3%, now part of every Waypoint project.
Hardware that lasts
Larger solar panels for busy sites, and the start of Waypoint’s own camera.
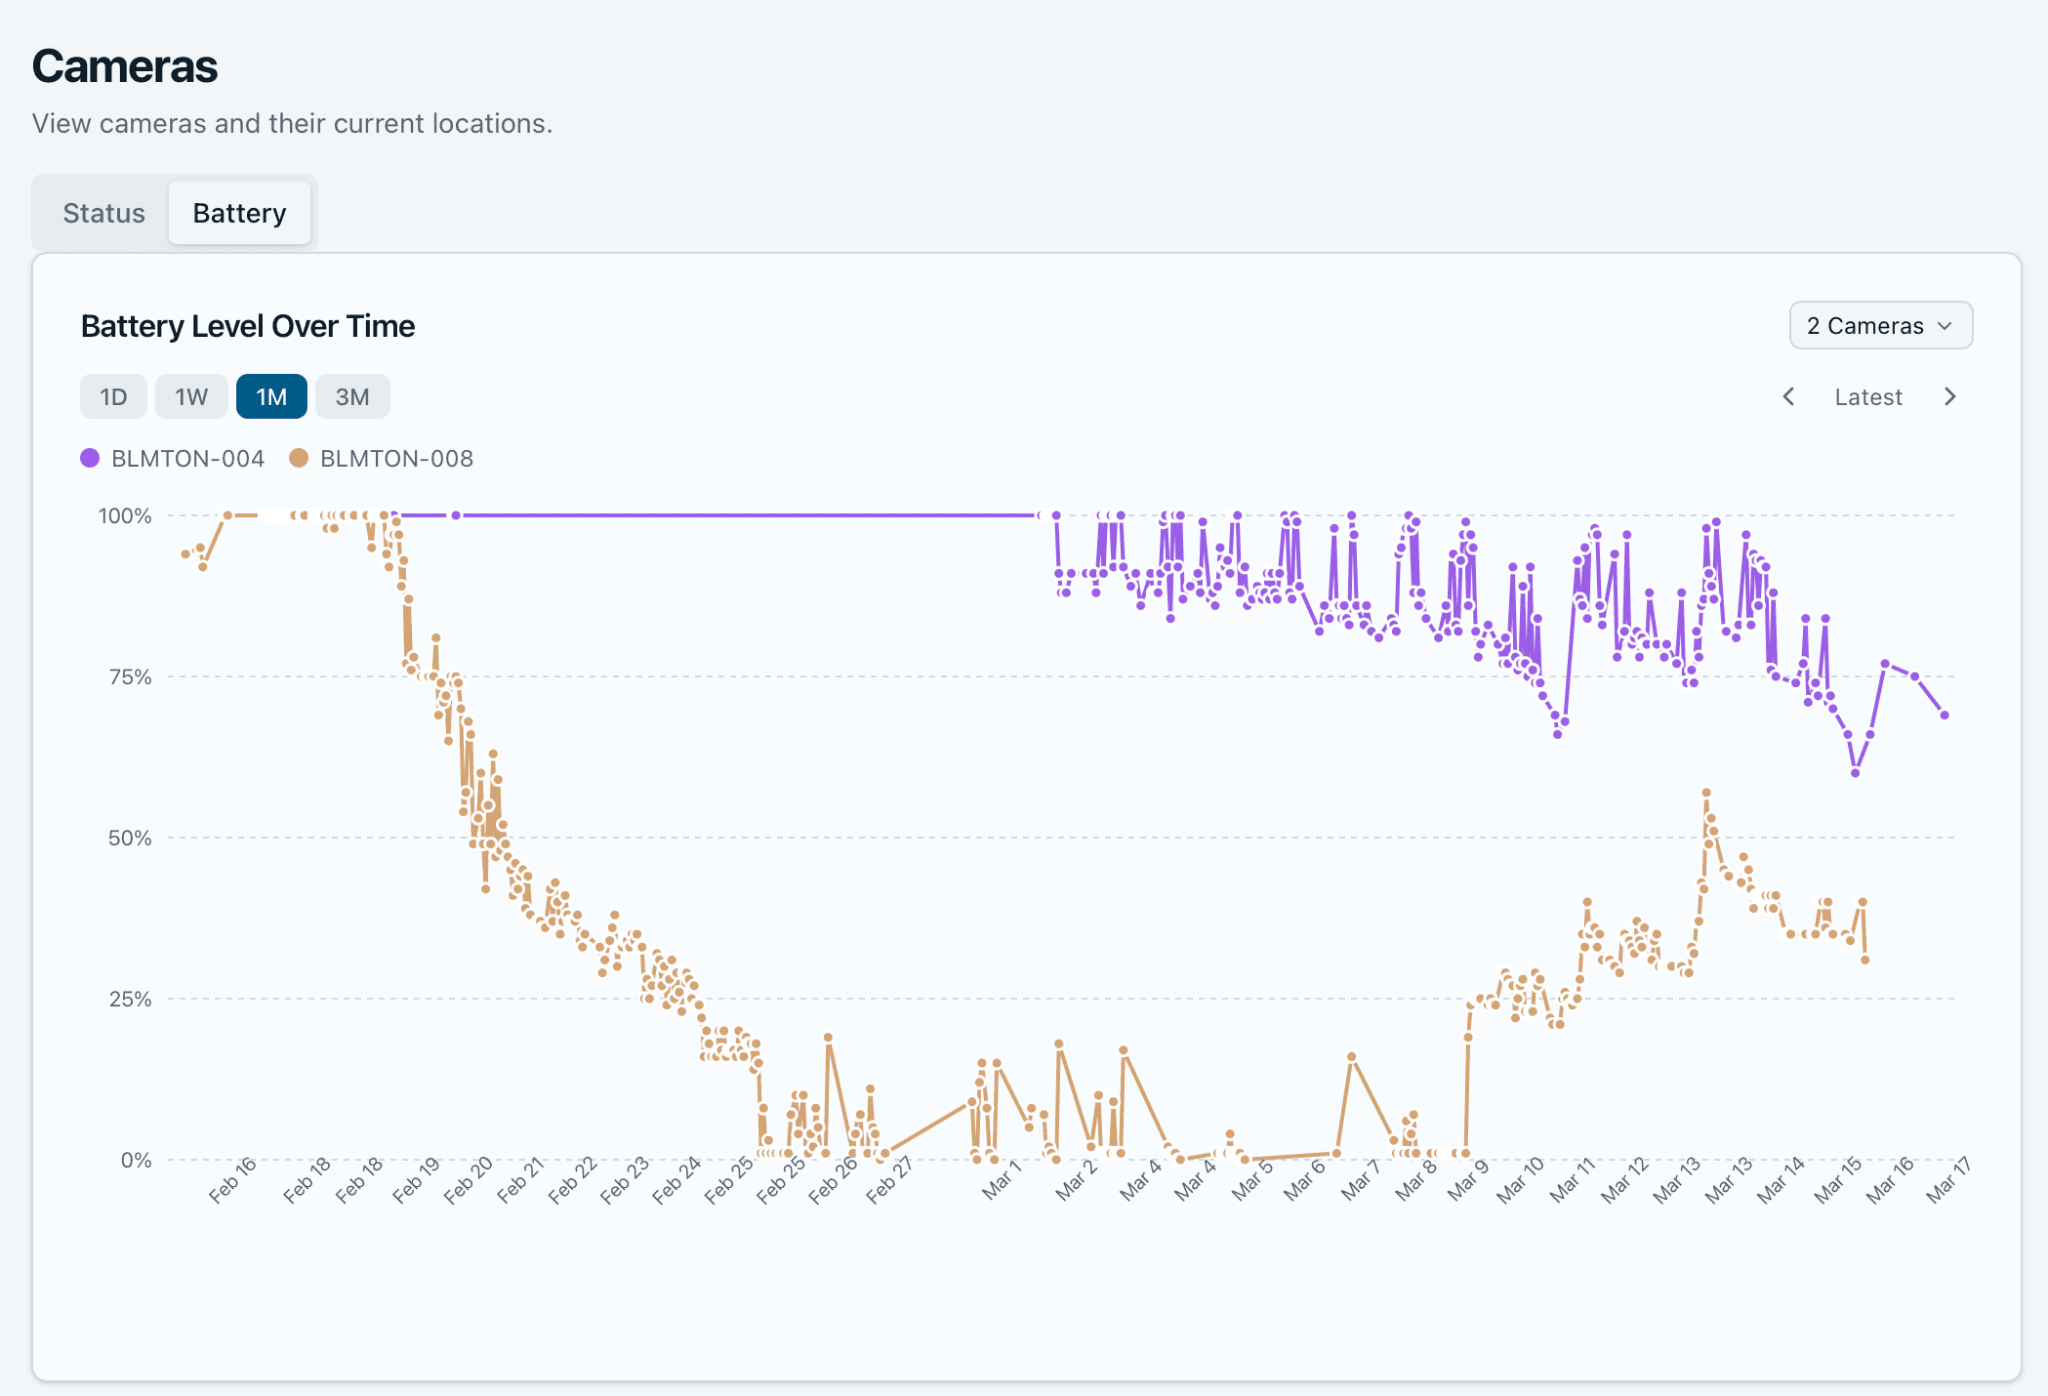
Winter was hard on the hardware. The two busiest sites drained their batteries on the standard solar panel, and snow piled on the panels after storms. Fitting a panel about four times larger in early March fixed the busiest camera, which now ships as the option for high-traffic sites.
The pilot also showed the limits of off-the-shelf trail cameras for accurate, reliable recreation data. That is why Waypoint began designing its own camera, VisionAI One, built around counting rather than hunting.
09 · Lessons learned
What we learned
- 01
Count each person once.
Busy days and lingering visitors multiply counts. Deduplicating across consecutive photos matters as much as detecting people in the first place.
- 02
Size power to traffic.
A camera at a busy entrance fires far more often than one on a quiet trail, and needs a bigger panel, especially in a Minnesota February.
- 03
Count by trail, not just by park.
A ski trail was 46% skiers and a nearby walking trail had none. A park-wide share would describe neither.
- 04
Conditions drive winter use.
Daily counts beside weather show when skiing depends on snow and grooming, which a seasonal multiplier can’t.
- 05
Validate against people, not just devices.
Two counters that agree on the pattern but not the total need a manual count to settle which is right.
Thanks to Three Rivers Park District for hosting the pilot and sharing its expertise in park visitor research.
10 · Sources
Sources
- Three Rivers Park District, Mission and vision
- Three Rivers Park District, About us
- Three Rivers Park District, Hyland Lake Park Reserve
- Three Rivers Park District, Winter Play Day
- Three Rivers Park District, Improving parks through data: my experience as a parks researcher
- Metropolitan Council, 2025 park and trail use estimate methodology (July 2026)
- Metropolitan Council, Regional park and trail use in 2025 (July 2026)
- National Weather Service Twin Cities, MSP climate summary, March 2026 (preliminary)
- Minnesota DNR State Climatology Office, Record warmth on March 21, 2026
Pilot counts and charts come from the Waypoint Analytics platform for the Three Rivers Hyland Lake pilot, Feb 17 – Mar 16, 2026, and Waypoint’s pilot reports to Three Rivers (March 2026). Engineering notes are in the original deployment write-up.