
01 · The challenge
A fast-growing park with no reliable picture of its riders
Redhead Mountain Bike Park sits on 1,225 acres of idled mine land in Chisholm, on Minnesota’s Iron Range.[3] Its trails are cut into the walls of a flooded pit about 400 feet deep, where visitors also paddle and swim.[2] The City of Chisholm owns and runs the park, with the Minnesota Discovery Center hosting the trailhead and volunteers from Iron Range Off-Road Cyclists maintaining trails.[5]
The park keeps growing, and every phase raises the same questions. How many people use the trails, and through which entrances, including the one shared with ATV traffic? When are the trails busiest? And on trails designed for bikes travelling in one direction, do people actually use them that way?
02 · Background
From an idle mine pit to a regional park
2018
Iron Range Resources & Rehabilitation approved $4.95 million for up to 92 miles of mountain bike trail at Redhead, Tioga and Giants Ridge, following the example of the Cuyuna trails near Crosby.[4]
2020 – 2022
The first 15 miles opened in June 2020.[1] By 2022 the system had about 25 miles and had won two statewide awards for turning mine land into recreation.[3]
2023
The Environment and Natural Resources Trust Fund awarded $1,666,000 for a second phase: up to 12 miles of trail, a pump track and a skills course.[6] Phase 2 connector trails were also meant to cut down on two-way trails.[10]
2025
Redhead was designated a regional park by the Greater Minnesota Regional Parks and Trails Commission.[7] Trail counters logged about 27,000 visits that year.[8]
May 2026
A new trailhead opened with a paved pump track, skills course, adaptive trails and a race gate.[9]
Jul 16 – Oct 31, 2026
Redhead and the city ran a pilot with Waypoint at 4 locations to measure use, entrance traffic and direction of travel.
03 · Why counts weren’t enough
A visit count can’t tell you which way people are going
Redhead already had an estimate of total visits. What a basic counter can’t say is who those visitors are and what they do on the trail. Parts of the system are one-way: the Rim trail, for example, runs one way into Tough Mama.[11] A rider coming downhill fast on a one-way trail doesn’t expect someone climbing toward them, or a walker around the next corner.
The park needed counts it could trust, split by activity and by direction, and the photos behind them, so it could see exactly what happened and decide what to do about signs, trail design and education.
04 · The approach
Four stations, from the trailhead to the ATV trail
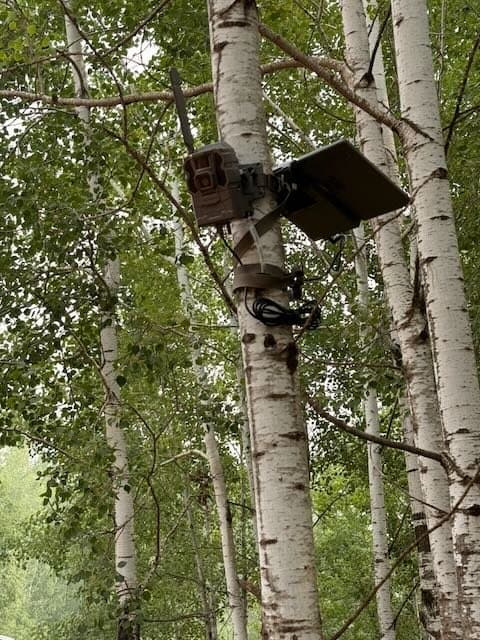
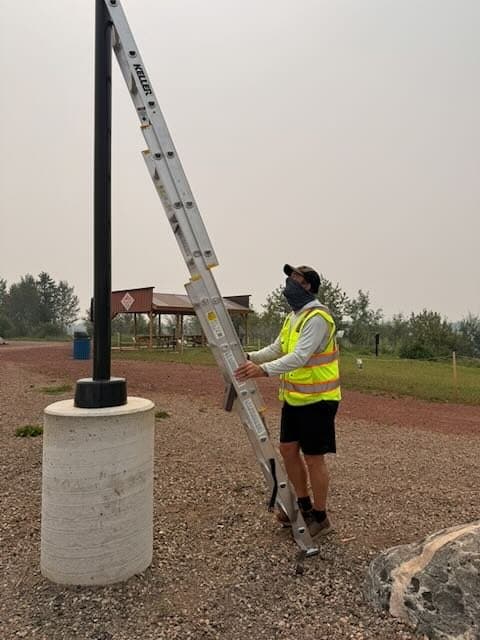
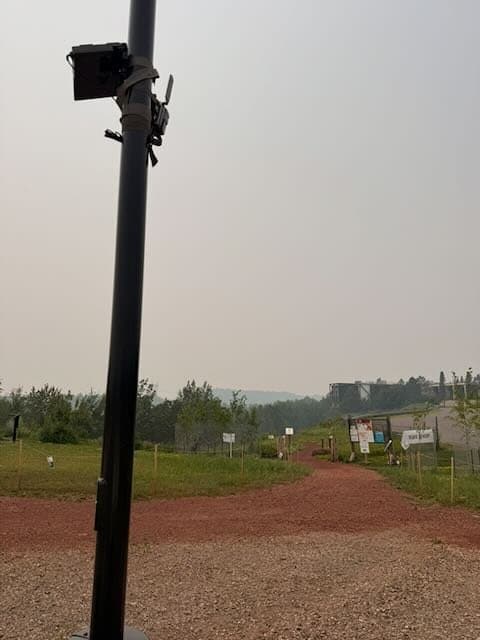
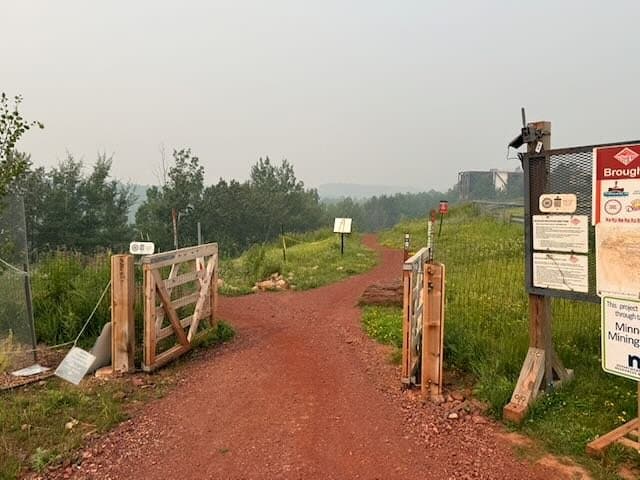
Waypoint and Redhead chose 4 locations together: the main entrance at the trailhead, the skills and pump track area, the entrance from the ATV trail, and a two-way section of the North Star loop. Each station is a solar-powered cellular camera on a tree or post, installed in a day with non-destructive straps, no digging and no power. A Redhead-branded “Visitor Use Counter” tag with a QR code on each station explained the study.
Every passage is classified by activity and by direction of travel, cyclists are checked for helmets, faces and license plates are blurred automatically, and each count links to the photo behind it. See how directional counting works and how it is validated.
05 · Zones and exclusions
Counting the trail, not the parking lot
The best place to watch the skills and pump track area also looks across the trailhead and its parking lot. Cars and trucks driving through the lot, and people walking to them, showed up as passages that had nothing to do with riding.
The fix took a few minutes. We drew an exclusion over the lot and the walkway behind the track, directly on a camera photo. Anything detected only inside that shape is left out of every count, for every day the camera has been in place, and the photos stay available for review. Saving it recalculated 95,380 passages and objects for the whole project in 28.6 seconds.
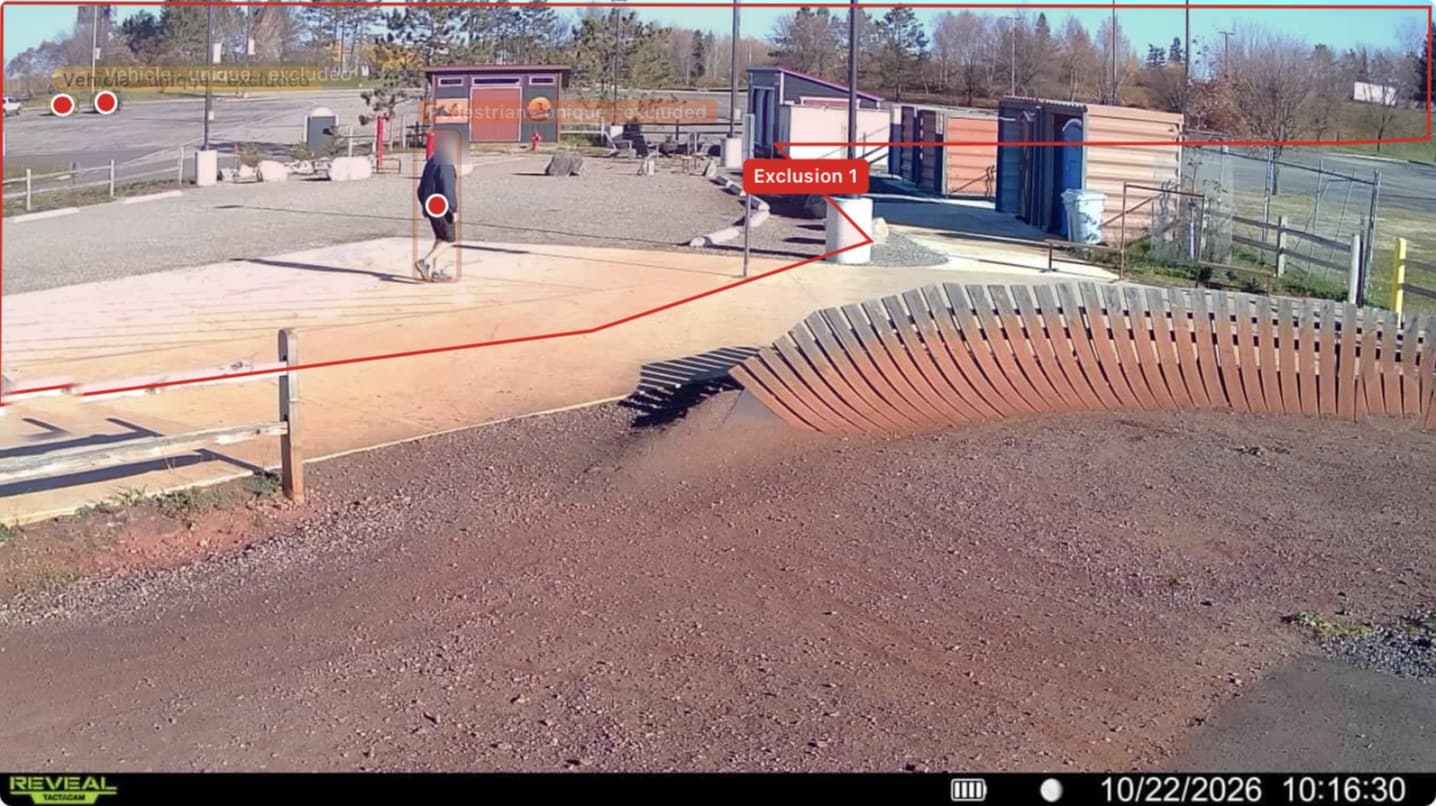
The same tool draws zones, so one camera can report separate areas, such as a pump track and the skills features beside it. See how noise filtering is validated.
06 · Results
Bikes lead, and the skills area is the busiest place in the park
In 107 days the four stations counted 50,488 passages. 43% were bicyclists and 38% pedestrians. The other 19% were mostly vehicles, plus ATV riders, motorcycles and maintenance vehicles. Almost every pedestrian was walking (97%), and 80% of people arrived in a group rather than alone.
The skills and pump track area was by far the busiest station, with up to 351 passages a day, against about 7 a day at the quietest. Over one month it saw nearly three times as many cyclists as the main entrance, though that camera lost part of the month to a flat battery. The entrance from the ATV trail carried a steady trickle of riders too.
- Bicyclist
- 43%
- Pedestrian
- 38%
- Other
- 19%
- Skills & pump track2,562
- Main entrance870
- ATV trail entrance154
- North Star two-way section80
73%
of cyclists wore a helmet, of 10,777 where it could be seen
80%
of people were in a group
97%
of pedestrians were walking, not running
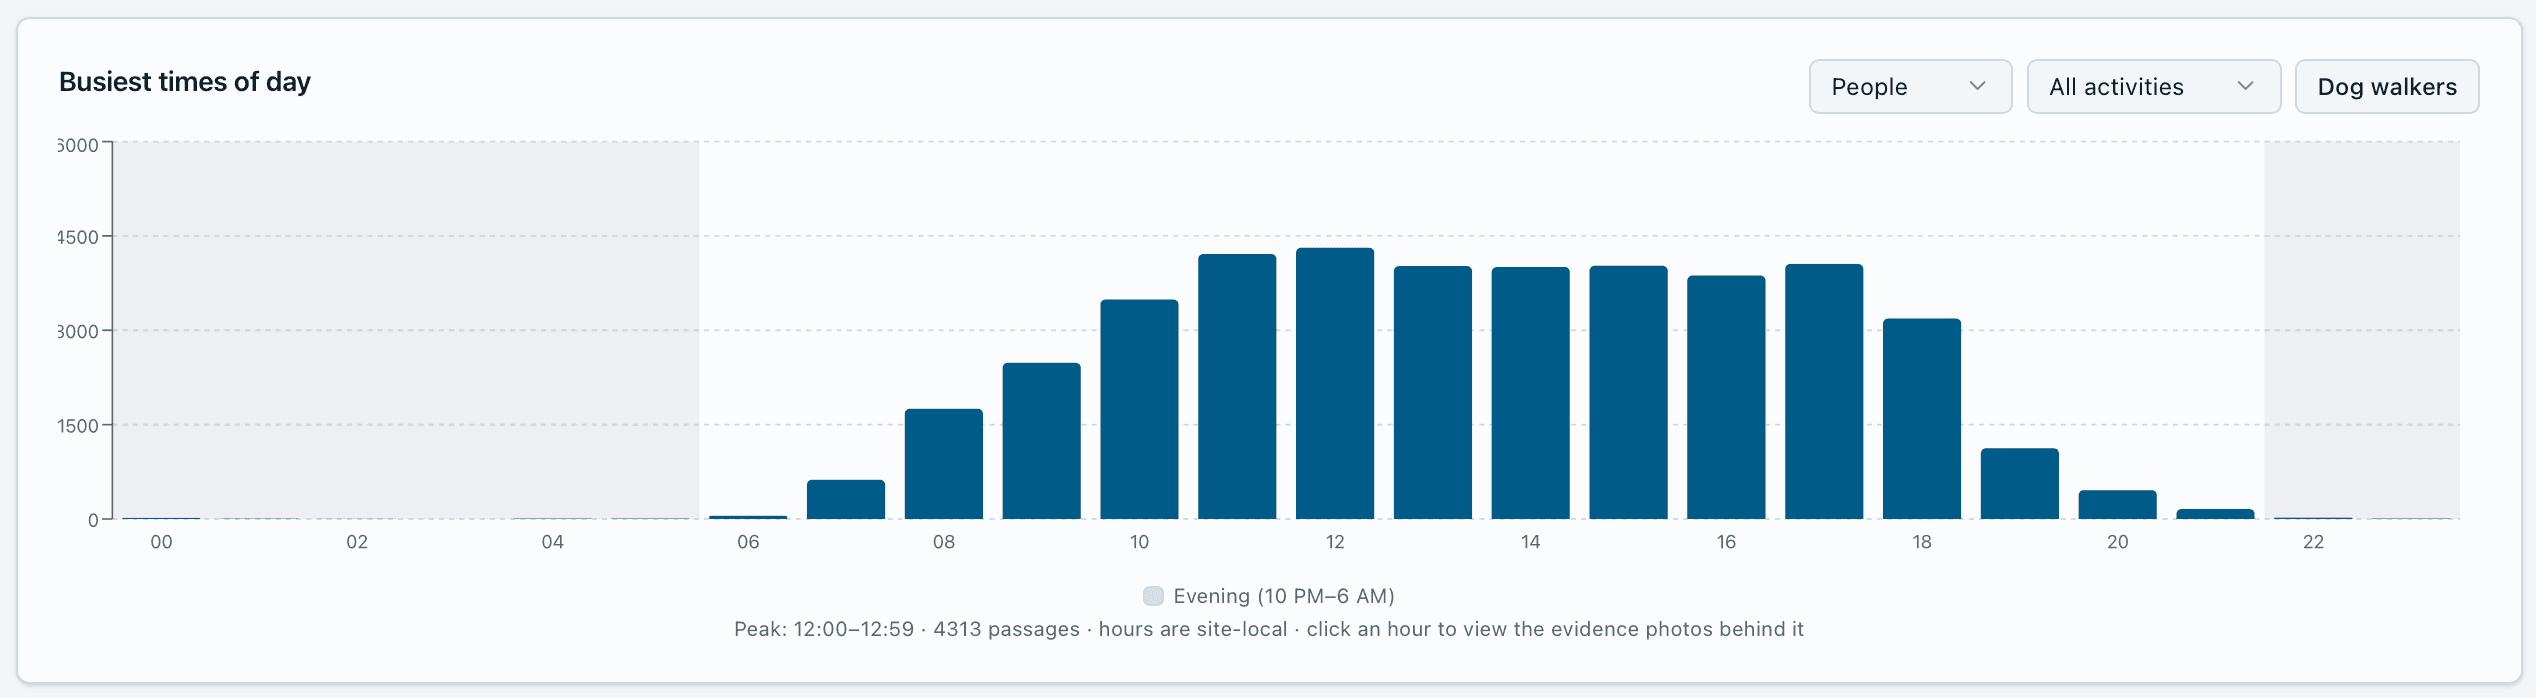
12 – 1 p.m.
busiest hour, 4,313 passages over the pilot
State championship weekend: more than a typical month in three days
A typical day at Redhead brought a few hundred passages. On October 10 and 11, Redhead hosted the Minnesota Cycling Association’s State Championship, the finale of the 2026 high school and middle school mountain bike season.[14][15] From Friday, October 9, through Sunday’s varsity races, counts jumped to thousands a day, with nearly 10,000 passages on the busiest day, and people on foot outnumbered riders. Earlier league races at Redhead drew more than 1,400 racers and about 4,000 people in total.[10] Because every count links to its photos, the park can report the championship on its own, as evidence of what events bring to Chisholm, and keep it out of everyday averages.
Trail rules in practice
Parts of the system are meant for bikes travelling one way. The cameras recorded pedestrians on a bike-only trail and riders going both directions on a one-way section, each with a photo the park can review. That turns a safety concern into evidence for signs, rider education or trail design.
Counting started in the worst smoke on record
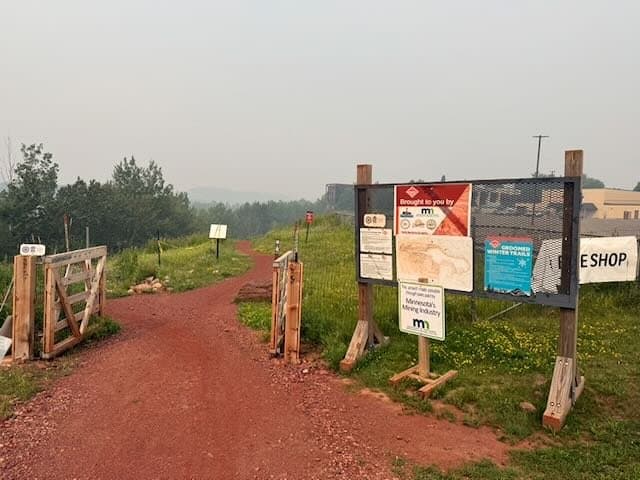
The stations went up on July 16, in the middle of Minnesota’s worst wildfire smoke outbreak on record. Fires in and around the Boundary Waters, plus smoke from Ontario, led to a peacetime emergency on July 14, 2026.[12] The state’s air quality alert for July 17 to 20 rated nearby Hibbing in the hazardous range.[13]
With weather shown beside each day’s counts, the park can see how smoke, rain and heat move riding up and down, and compare like with like from one season to the next.
07 · What it means for Redhead
Evidence for safety, planning and the next grant
Safer trails
Helmet use, wrong-way riding and pedestrians on bike-only trails, each backed by photos, show where signs, education or design changes would help.
Entrance planning
Traffic by entrance, including from the ATV trail, shows where wayfinding, parking and maintenance matter most.
Auditable grant data
Every number is backed by a photo, which holds up in grant reports where trail use is scrutinized.
Redhead has been built almost entirely with grants and public investment, and each new phase is justified by use. Counts split by activity, entrance and direction give the park and the city a stronger case for that investment, and a baseline to measure the next phase against.
08 · Lessons learned
What we learned
- 01
Draw the edges of the count.
A camera placed for a trail often sees a road or parking lot too. An exclusion drawn once keeps that traffic out of every number, past and future.
- 02
Measure the rules, not just the riders.
Direction and activity on a one-way, bike-only trail show whether the design is working, which a total count never will.
- 03
Expect the unexpected season.
Smoke, storms and closures happen. Daily data lets you see them, explain them and keep them out of the baseline.
09 · Sources
Sources
- Barr Engineering, Redhead Mountain Bike Park opens to the public (June 17, 2020)
- Mesabi Trail, Mountain bike trails
- The Timberjay, Redhead garners two statewide awards (Apr. 13, 2022)
- MPR News, Iron Range board OKs $5 million for mountain bike trails (Jan. 24, 2018)
- Mesabi Tribune, Redhead experiences a good 2023 riding season (Nov. 20, 2023)
- Minnesota Legislative Coordinating Commission, Legacy site: Redhead Mountain Bike Park (ENRTF, M.L. 2023)
- Mesabi Tribune, Redhead receives regional trail designation (2025)
- Iron Range Resources & Rehabilitation, The Ranger newsletter (June 4, 2026)
- WDIO, Redhead Mountain Bike Park grand opening (May 29, 2026)
- Mesabi Tribune, Trail expansion projects take shape on former mine lands (2024)
- Iron Range Tourism, Redhead Mountain Bike Park
- Minnesota DNR State Climatology Office, Dangerous smoke outbreak, July 14–17, 2026
- MPCA, Air quality alert for wildfire smoke, July 17–20, 2026
- Iron Range Off-Road Cyclists, Minnesota Cycling Association State Championship at Redhead MTB Park (Oct. 10–11, 2026)
- RAC MTB, Race #5: State Championship at Redhead Mt Bike Park (Oct. 12, 2026)
Pilot counts come from the Waypoint Analytics platform for the Redhead Mountain Bike Park pilot, Jul 16 – Oct 31, 2026.